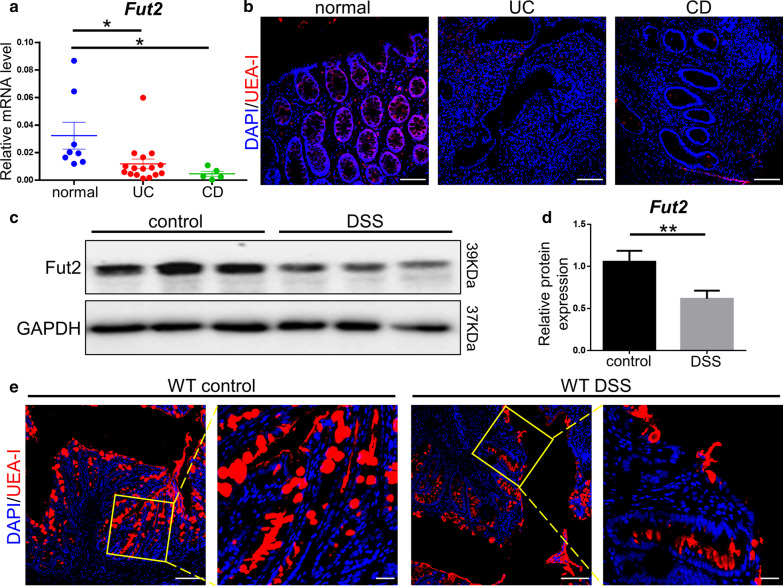
Fig. 1.
Down regulation of Fut2 and α-1,2-fucosylation in IBD patients and DSS-induced mice. a The relative mRNA expression of Fut2 in normal colon tissues and in that of UC, and CD patients was detected by qPCR (n = 8, 16, 5 for each group). b Typical UEA-I (a specific lectin for α-1,2-fucosylation) staining (red) images of normal, UC, and CD colon tissue (Scale bar, 100 μm). c, d The proteins level of Fut2 in the colonic epithelial cells extracted from WT mice exposed or not exposed to DSS (n = 3 per group). e The typical images of mice colon tissues stained with UEA-I (Scale bar, 100 μm, 50 μm). Data are expressed as mean ± SEM. The data come from three independent experiments. In all panels: *p < 0.05, **p < 0.01. (UEA-I Ulex Europaeus Agglutinin-I)

