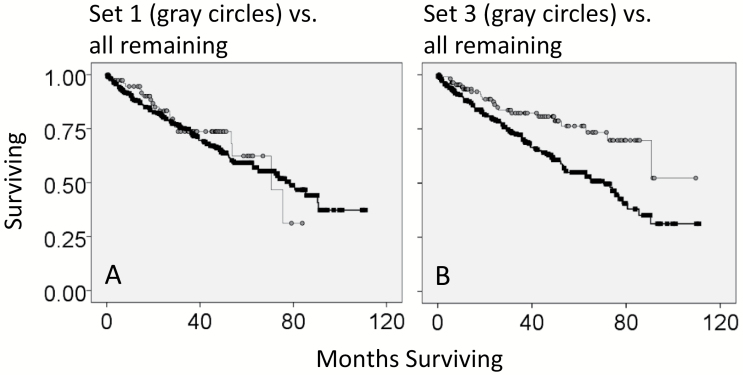
Fig. 3.
Survival rates for different sets of barcodes representing different recoveries of TcR recombination reads, in comparison to all remaining barcodes. (A) Kaplan–Meier (KM) survival curve for barcodes with both productive TcR-α and TCR-β recombination reads (Set 1; gray circles) against the remaining samples (black squares). Log rank P value = 0.637. (B) KM survival curve for barcodes with only productive TcR-α (absence of productive TcR-β) (gray circles) against all remaining samples (black squares). Log rank P value = 0.001.

