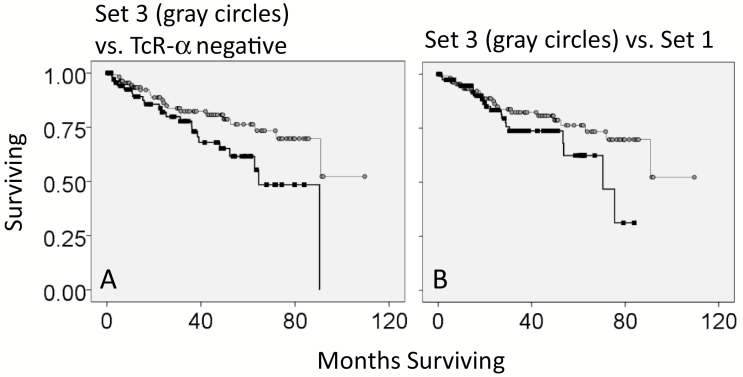
Fig. 4.
Comparison of specific subsets of barcodes, representing different recoveries of TcR recombination reads. (A) Kaplan–Meier (KM) survival curve for barcodes with only productive TcR-α (absence of productive TcR-β) (Set 3) (gray circles) against barcodes with the absence of productive TcR-α (black squares). Log rank P value = 0.028. (B) KM survival curve for barcodes with productive TcR-α and absence of productive TcR-β (Set 3) (gray circles) against barcodes with the co-detection of productive TcR-α and TCR-β (Set 1) (black squares). Log rank P value = 0.107.

