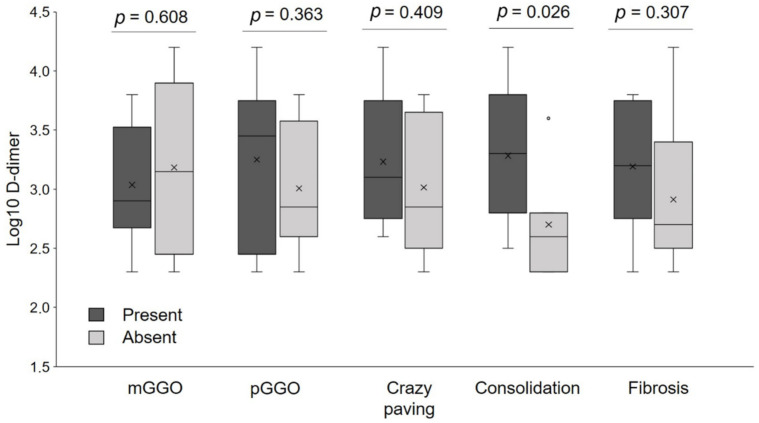
Figure 5.
Distribution of D-dimer at admission in patients with different radiological pattern at the chest computed tomography (CT) performed at the time of first evaluation. Note that the only significant difference in D-dimer was in patients with and without parenchymal consolidations. Vertical lines represent the 75th and 25th percentile. Horizontal bars are medians. X signs indicate means. pGGO = peripheral ground glass opacities; mGGO = multifocal ground glass opacities.

