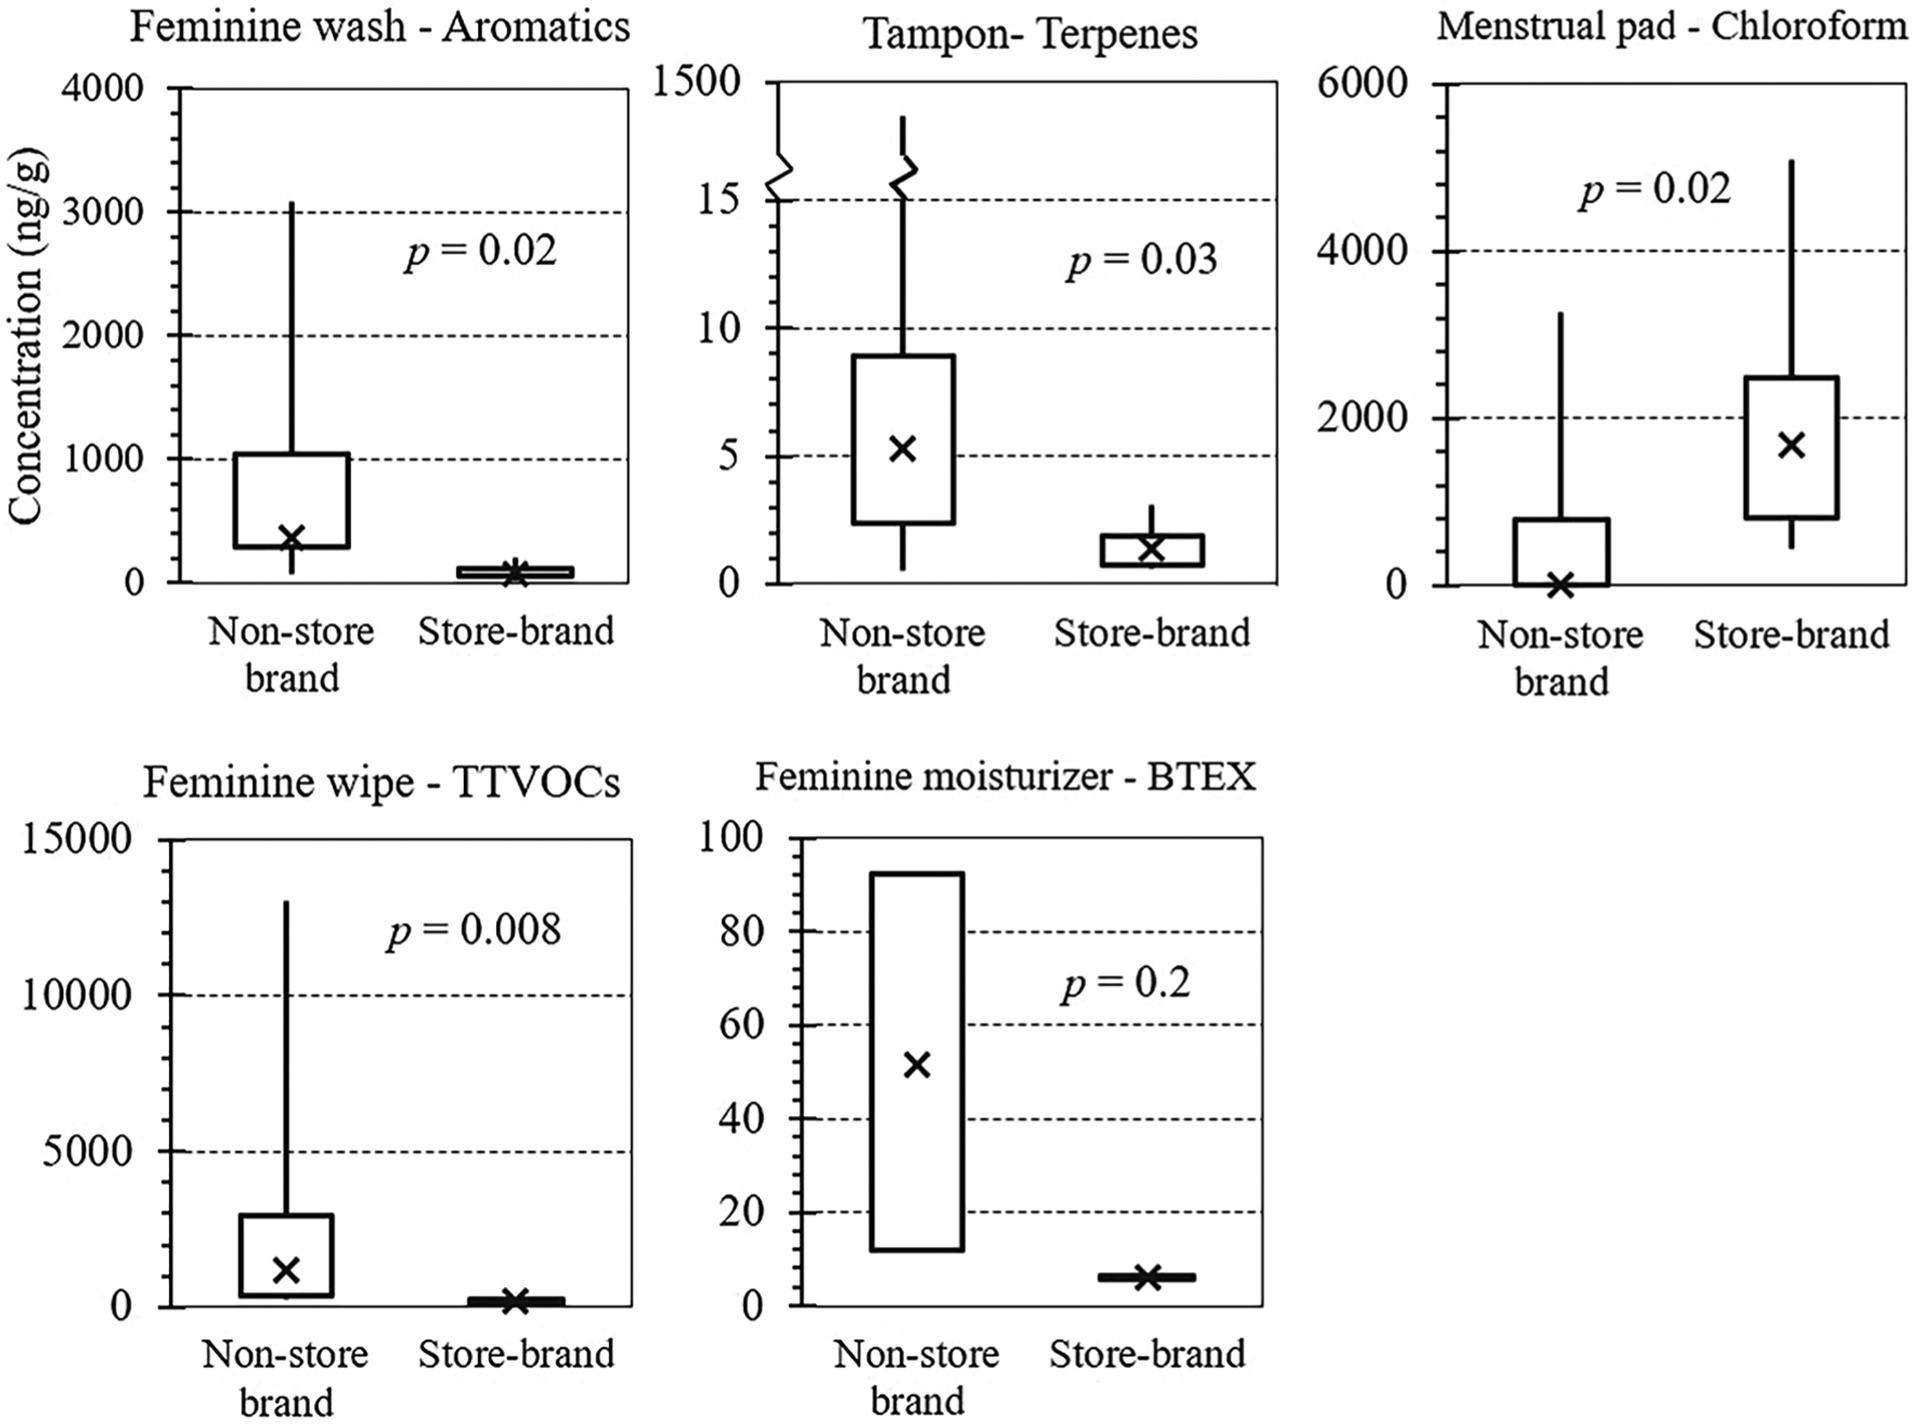
Fig. 1.

Boxplots of specific VOC concentrations (ng/g) in feminine hygiene products between non-store brand and store brand. Shows maximum, 75th percentile, median (shown as cross), 25th percentile, and minimum concentrations. P-values are from Mann-Whitney U tests.
