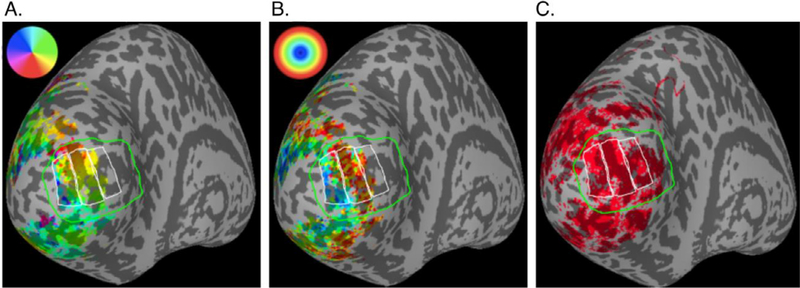
Fig. 2.
Retinotopic mapping of V1 and manually drawn ROIs. In each panel, the green line borders the probabilistic topography of V1 (Wang et al., 2015) and the white lines indicate the parafoveal (~2–4° eccentricity), middle (~4–8°), and peripheral (~8–20°) ROIs. A) The color overlay indicates polar angle estimated from pRF mapping scans. This was used to verify the location of the V1 border. B) The color overlay indicates estimated eccentricity from the pRF mapping scans, in which stimuli did not go beyond 8° eccentricity because the fixation point was in the center of the screen and the stimulus was circular. C) Red indicates a binary mask of activation from the main experiment (p < 0.001 single-voxel F-statistic, p < 0.001 after cluster-wise correction for multiple comparisons). In the functional scans, participants fixated on one side of the screen, so stimuli extended to 20° eccentricity. Therefore, the peripheral ROI was drawn past the extent of the retinotopy data to include the full extent of the data from the main experiment.

