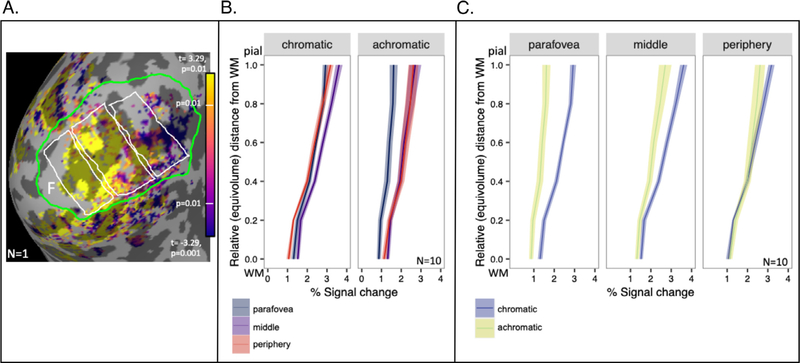
Fig. 4.
Responses to chromatic and achromatic stimuli in V1. A) T-statistics for chromatic selectivity are displayed for one participant (S1) on an inflated representation of the medial aspect of occipital cortex of the left hemisphere. Surface nodes with significant visual responses to all stimuli (p < 0.001, after cluster-wise correction) are displayed in color on an inflated representation of occipital lobe, where dark gray indicates sulci and light gray indicates gyri. Foveal retinotopic cortex is labeled with the letter “F”. Parafoveal, middle, and peripheral ROIs are indicated by white borders (parafoveal is the leftmost ROI adjacent to the fovea). The V1 boundary is indicated by a green border. B) Estimates of the magnitude of responses to chromatic and achromatic stimuli in each of the three ROIs. Data represent responses from the 10 datasets (hemispheres) meeting all inclusion criteria; shading indicates standard error of the mean. C) The same data as in (B) are plotted again, grouped so comparisons between chromatic and achromatic responses can be made within each of the 3 ROIs.

