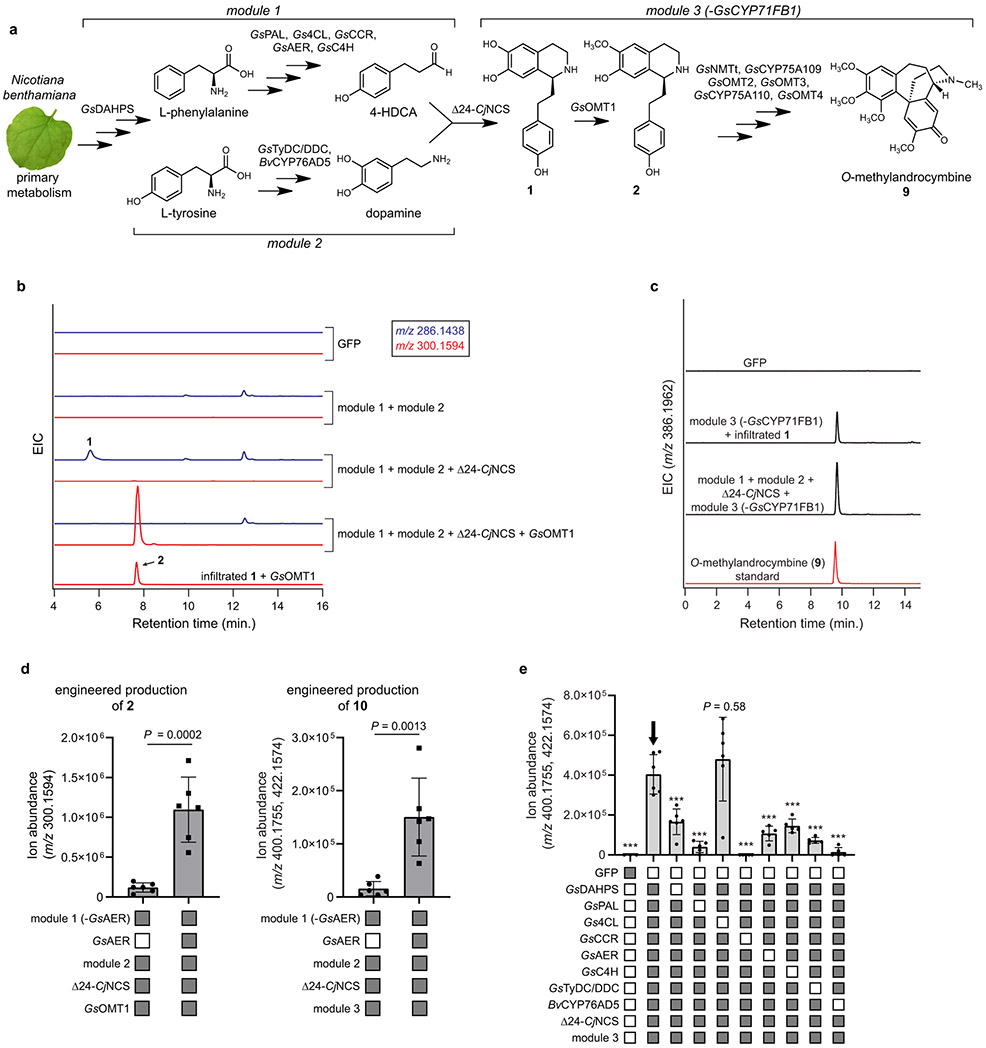
Extended Data Figure 11. Metabolic engineering of colchicine alkaloids in Nicotiana benthamiana.
a) Biosynthetic scheme of the transient metabolic engineering system in N. benthamiana for the production of 2 and 9. b) LC-MS chromatograms for the co-expression of GsOMT1 with module 1, module 2, and Δ24-CjNCS compared to that of GsOMT1 expressed alone with co-infiltration of 1. Shown are the extracted ion chromatograms (EICs) for 1 (blue traces, m/z 286.1438) and the production of 2 (red traces, m/z 300.1594). c) LC-MS chromatograms demonstrating the production of 9 via co-expression of module 3 (without GsCYP71FB1) with module 1, module 2, and Δ24-CjNCS. This is compared to infiltration of 1 (as substrate) with co-expression of module 3 (without GsCYP71FB1), as well as to a standard of O-methylandrocymbine (9). Shown are the EICs specific to the exact mass of 9 (m/z 386.1962). Engineered production of 2 and 9 was demonstrated three times for each molecule. d) Production of two different colchicine alkaloids (2, m/z 300.1594; 10, m/z 400.1755, 422.1574) via metabolic engineering in N. benthamiana when GsAER is either omitted or included. Filled-in boxes (gray) indicate the presence of a module/gene within the co-expression experiment, while an empty box (white) indicates its absence. Shown for each reaction is the mean of 6 biological replicates ± standard deviation for each condition. Statistical significance was assessed using a two-tailed Student’s t-test with an assumption of unequal variance. Production of 2 in this context was assessed once, while production of 10 was performed twice with similar results each time. e) Individual dropout of each module 1 and module 2 gene within the engineered production of 10 (m/z 400.1755, 422.1574). Shown for each reaction is the mean ± standard deviation for each reaction condition. n=3 for GFP control; n=5 for PAL, CCR, AER, C4H, TyDC/DDC, and BvCYP76AD5 dropouts; n=6 for 4CL and DAHPS dropouts and for the no-dropout control. All replicates represent independent biological replicates. Statistical comparisons made using Dunnett’s test (two-tailed) with comparison to the full pathway control (indicated by arrow). *** = P < 0.001. This experiment was performed twice, with similar results each time.

