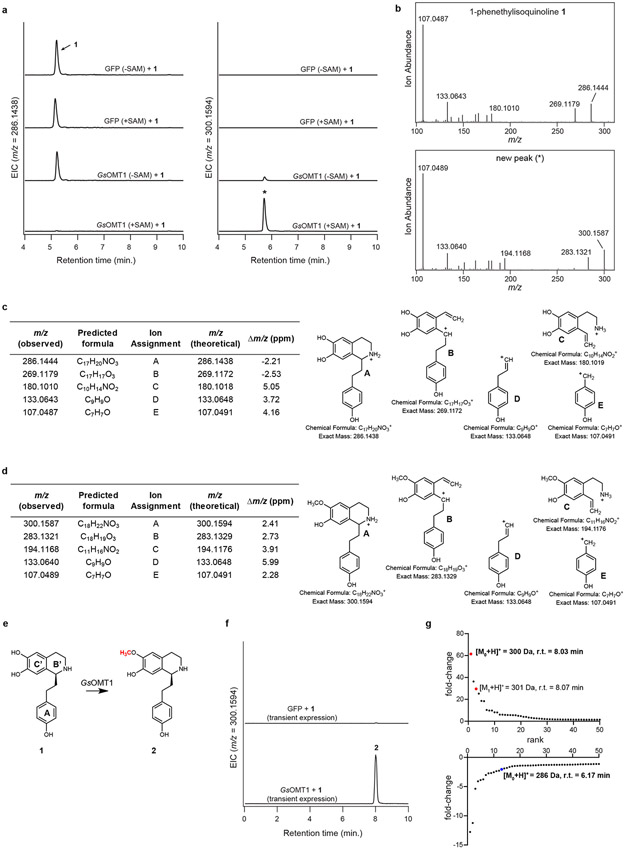
Extended Data Figure 1. Characterization of GsOMT1.
a) LC-MS chromatograms demonstrating activity on substrate (1) by protein lysates from Nicotiana benthamiana leaves transiently expressing GsOMT1. Shown are extracted ion chromatograms (EICs) for 1 (m/z 286.1438; left panel), as well as the methylated product (*) produced in this experiment (m/z 300.1594; right panel). This experiment was performed three times, with similar results each time. b) MS/MS fragmentation spectrum of 1, as well as the generated m/z 300.1594 product (*) at a collision energy of 20V. Fragmentation of both compounds was performed twice, with similar results observed each time. c) Tabulated list and putative structures for ion fragments generated from MS/MS analysis of 1. d) Tabulated list and putative structures for ion fragments generated from MS/MS analysis of the m/z 300.1594 product. See Supplementary Information for a detailed analysis of MS/MS results. e) Proposed reaction catalyzed by GsOMT1 as supported by MS/MS fragmentation and prior labeling studies. f) Transient expression of GsOMT1 in Nicotiana benthamiana with co-infiltrated substrate 1 results in production of methylated product (2), as shown here via LC-MS chromatograms. This experiment was performed >3 times with similar results observed each time. g) Untargeted metabolite analysis (XCMS) comparing transient expression of GFP (negative control) to that of GsOMT1 with co-infiltrated substrate 1 (n=3 independent replicates for each experimental condition). Shown are unique mass signatures (P < 0.1 between samples, as determined via XCMS) in ranked order based upon their increasing (top panel) or decreasing (bottom panel) fold-change in abundance between the two compared conditions (i.e. GFP vs. GsOMT1). The mass isotopologues (M0 and M1) for the presumed product (m/z 300.1594) are highlighted in red, while the substrate (1, m/z 286.1438) is highlighted in blue. r.t. = retention time.

