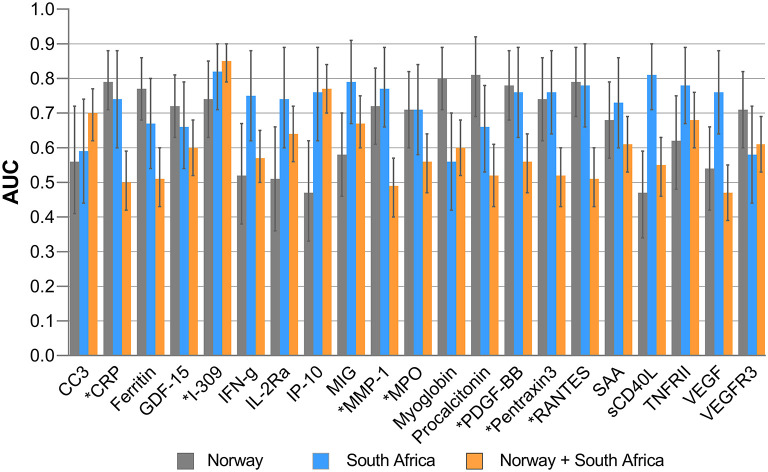
Figure 2.
Areas under the receiver operator characteristics (ROC) curves of significant biomarkers. AUC for individual analytes with significant differences in Norway and South Africa and their performance when all study participants from both settings were merged. Error bars represent 95% confidence interval of AUC. *Highlights markers with promising diagnostic accuracy in both Norway and South African cohorts.

