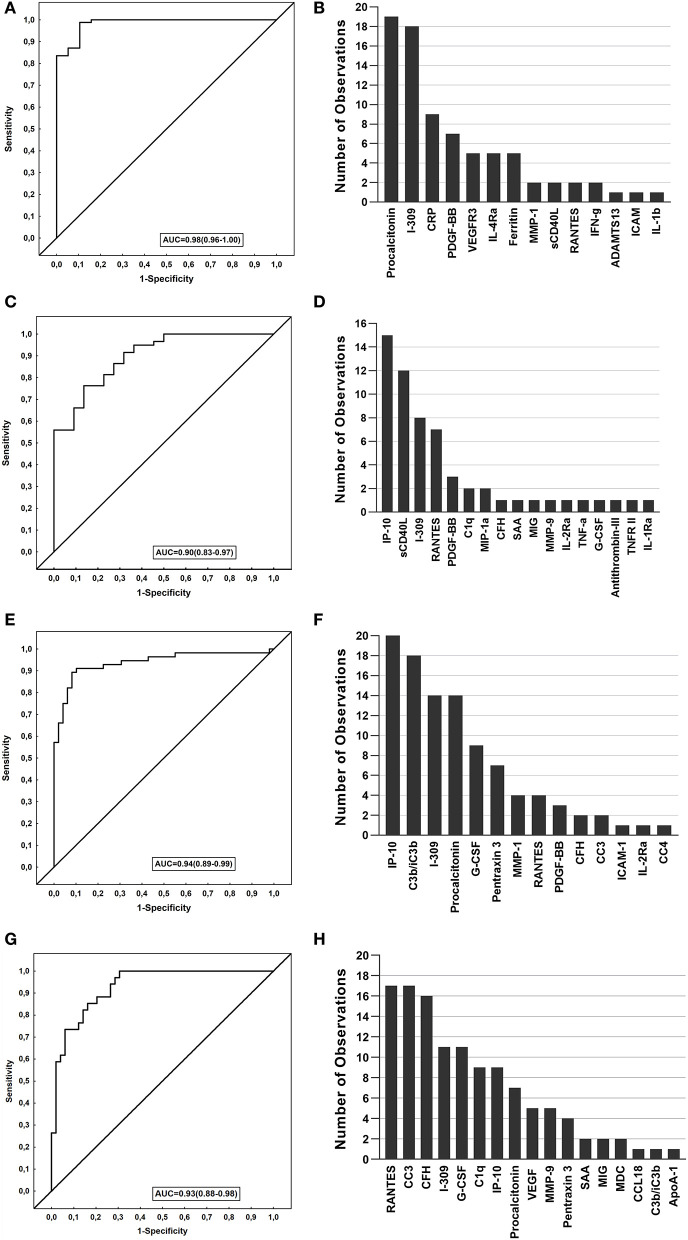
Figure 3.
Performance of biosignatures in the diagnosis of TB disease. The Receiver operator characteristics (ROC) curves showing the accuracies of the biosignatures generated. The bar graphs show the number of times each analyte was included in the top 20 general discriminant analysis (GDA) models for diagnosing TB. (A) ROC curve of the most accurate 4-marker biosignature (I-309, procalcitonin, CRP, PDGF-BB) which diagnosed TB in the Norwegian cohort. (B) Frequency of analytes in the top 20 GDA models that classified TB cases from ORD in Norwegian patients. (C) ROC curve of the most accurate 3-marker biosignature (MMP-9, IP-10 and sCD40L) which diagnosed TB in the South African cohort. (D) Frequency of analytes in the top 20 GDA model that classified the TB cases from ORD in South African patients. (E) ROC curve of the most accurate 5-marker biosignature (G-CSF, C3b/iC3b, procalcitonin, IP-10, and PDGF-BB) in diagnosing TB in all study participants from both cohorts. (F) Frequency of analytes in the top 20 GDA model that classified the TB cases from ORD in all study participants from both cohorts. (G) ROC curve of the most accurate 6-marker biosignature (RANTES, G-CSF, C1q, CC3, CFH, IP-10) in diagnosing pulmonary TB in all study participants from both cohorts. (H) Frequency of analytes in the top 20 GDA models that classified pulmonary TB from ORD in all study participants from both cohorts.

