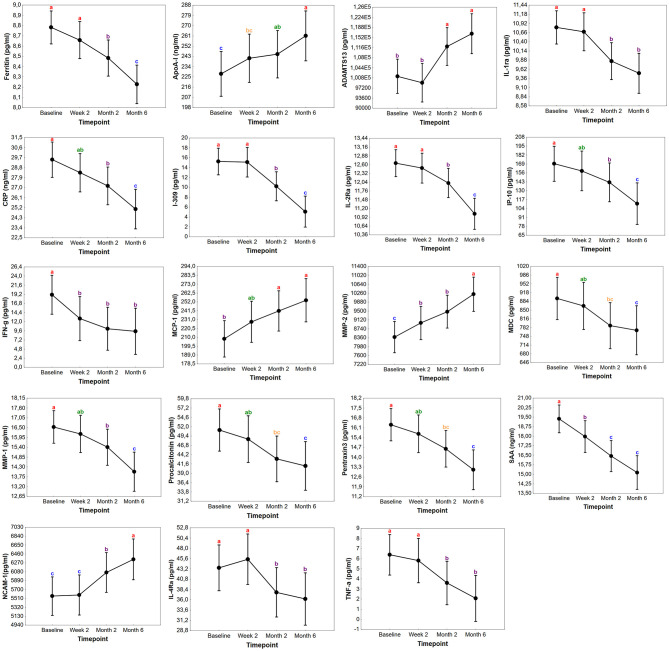
Figure 4.
Changes in the concentrations of biomarkers in TB patients during treatment in Norway. Concentrations of plasma markers in samples of Norwegian TB patients with significant differences before the start of TB treatment (baseline), at week 2, month 2, and month 6. Data points in each graph represent the mean and the error bars indicate the 95% confidence intervals. The concentrations of ADAMTS13, MMP-2, NCAM-1, MCP-1, ferritin, I-309, IFN-γ, IL-1Ra, IL-2Ra, pentraxin3, procalcitonin, IP-10, MMP-1, TNF-α, IL-4Ra, MDC are expressed as pg/ml while ApoA-1, SAA, and CRP as ng/ml. The letters a-c indicates statistical significance where values with the same letter are not significantly different from each other.

