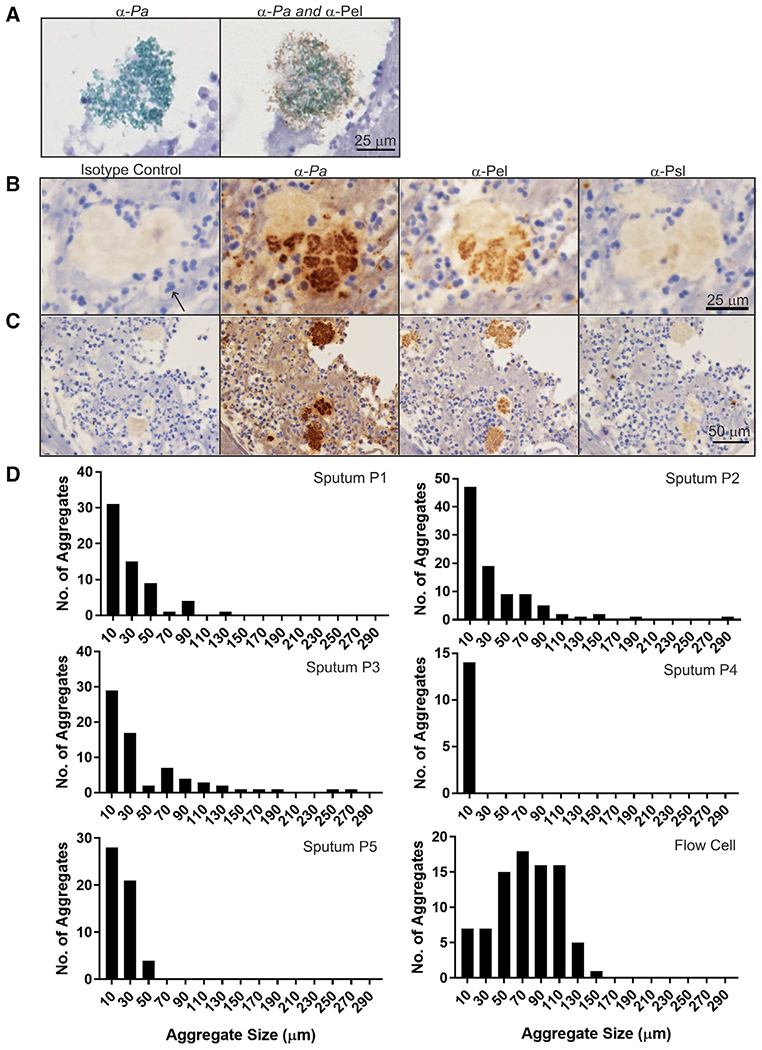
Figure 1. Characteristics and observations of the in vivo biofilm matrix.

(A) Dual IHC staining of a sputum aggregate showing Pel (brown) and P. aeruginosa (green). (B and C) Representative IHC images of Pel, Psl, and P. aeruginosa (Pa) antibodies (brown) applied to sequential slices of Pa-positive sputum. Hematoxylin counterstain is blue. A neutrophil is highlighted (arrow).
(B) Images showing larger Pa cell cluster that appears to consist of several smaller clusters.
(C) Images showing heterogeneity in Pa cell cluster size.
(D) Size distribution of Pa aggregates in sputum samples (P1–P5) and in vitro flow-cell biofilms from reference Colvin et al. (2012).
