Figure 7.

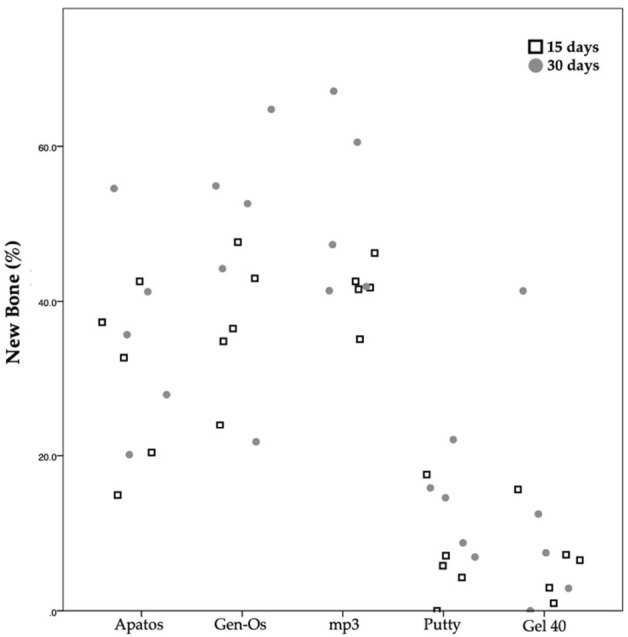
Scatter plot graph displaying the percentage of new bone measurements for different materials and at the two assessment times.

Scatter plot graph displaying the percentage of new bone measurements for different materials and at the two assessment times.