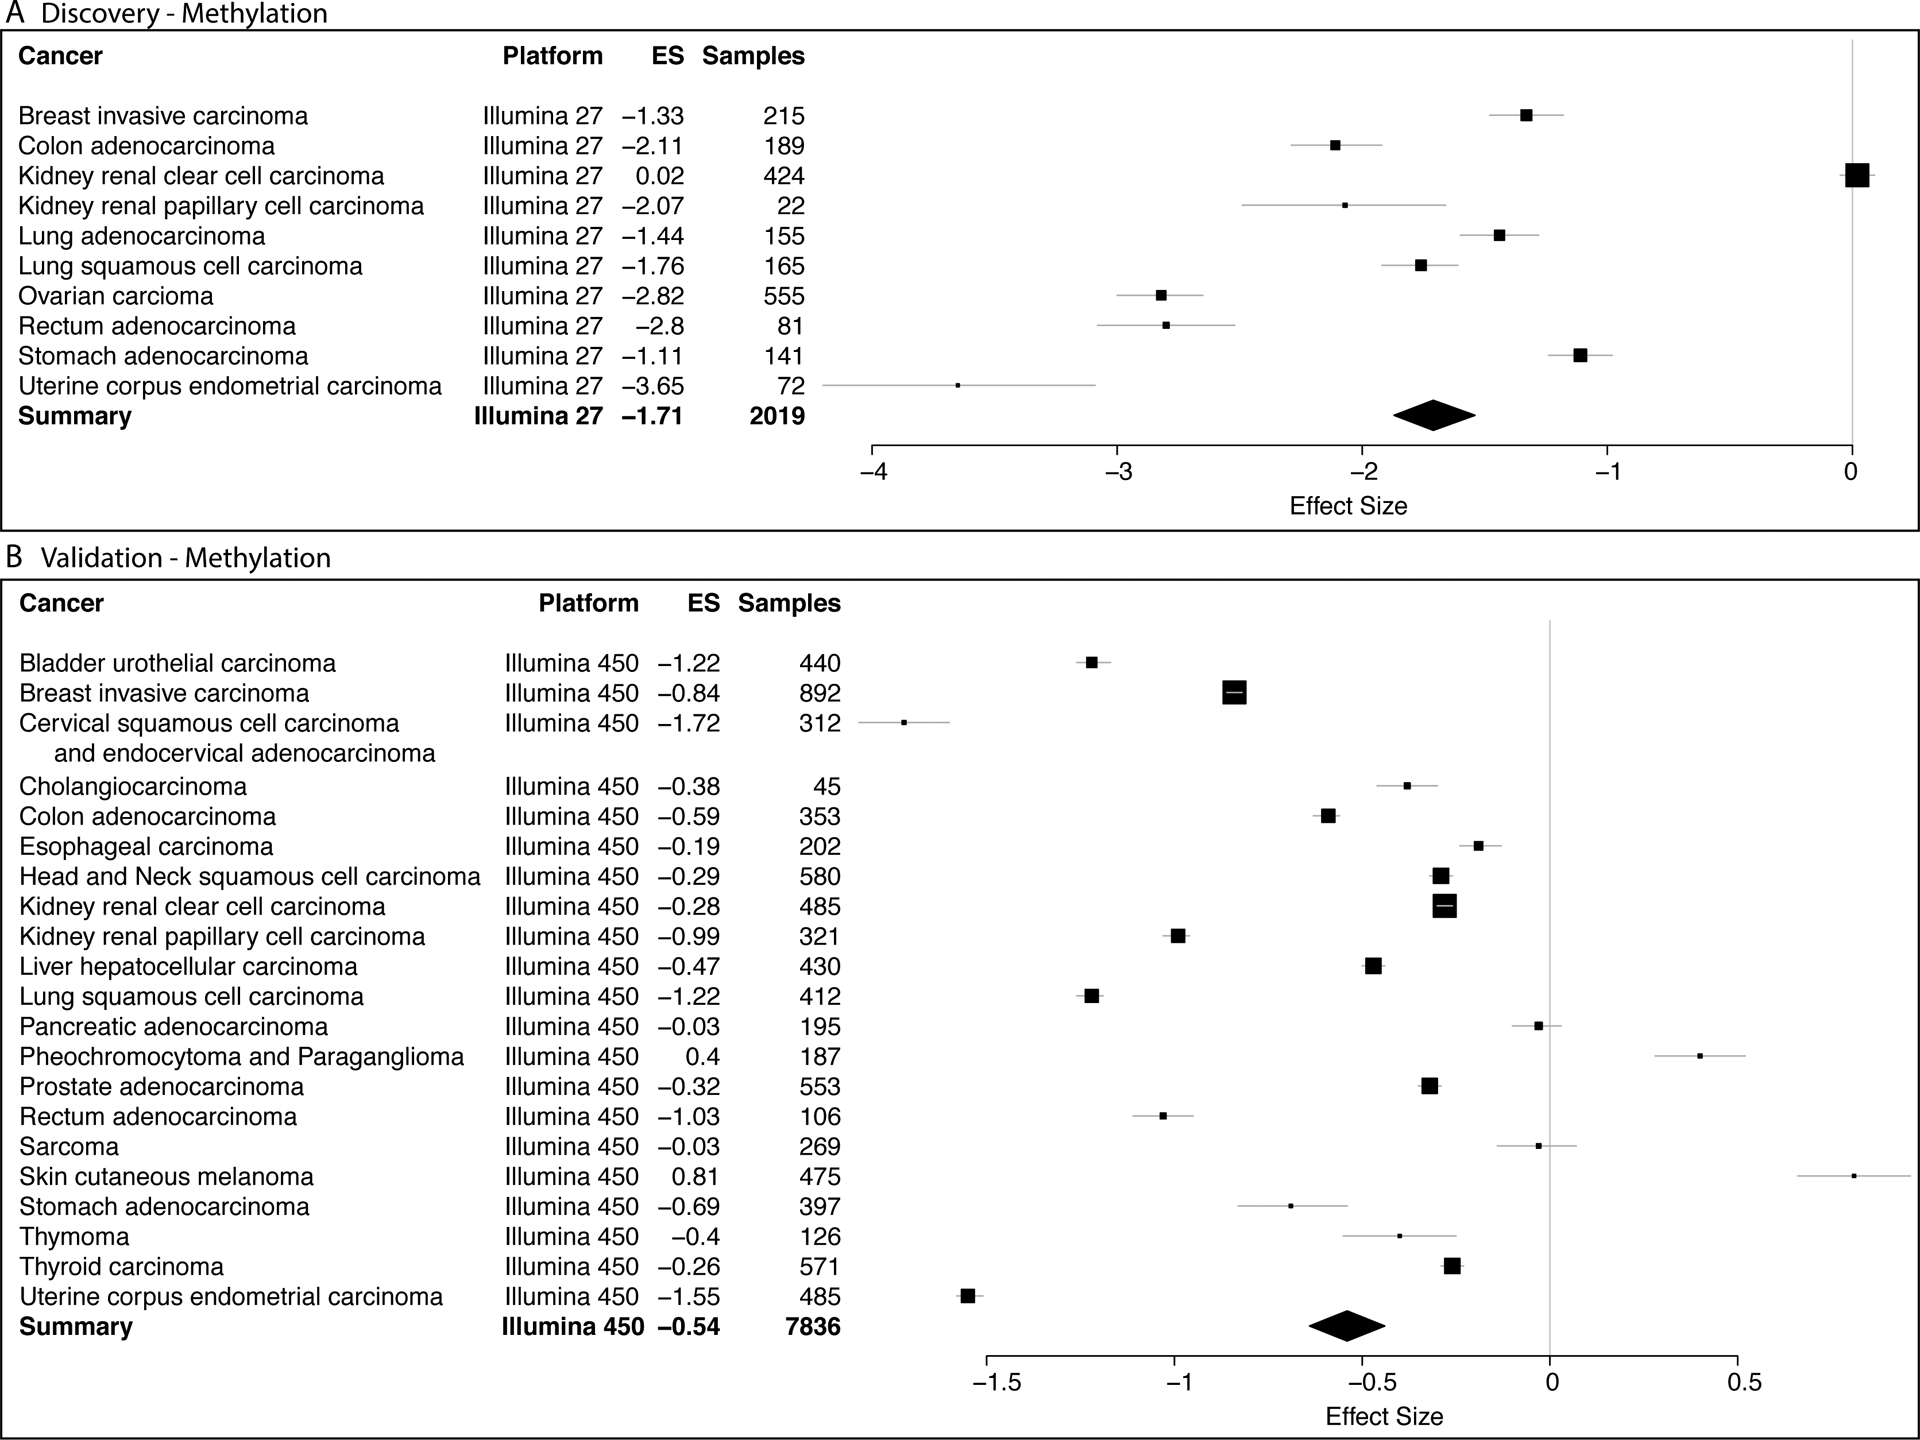
Figure 2. KRT8 is hypomethylated across 23 cancers.

Differential DNA methylation of KRT8 in (A) discovery (10 cancers, 2019 samples, Illumina 27 platform) and (B) validation (21 cancers, 7836 samples, Illumina 450 platform) tumor biopsy samples compared to control non-cancerous tissue. X axes represent standardized mean difference in DNA methylation between cancer and control samples, computed as Hedges’ g, in log2 scale. The size of a rectangle is inversely proportional to the SEM in the corresponding cancer cohort. Whiskers represent the 95% confidence interval. A diamond represents a summary effect size for KRT8 across cancers. Width of a diamond represents the 95% confidence interval of summary effect size. SEM: standard error of mean.
