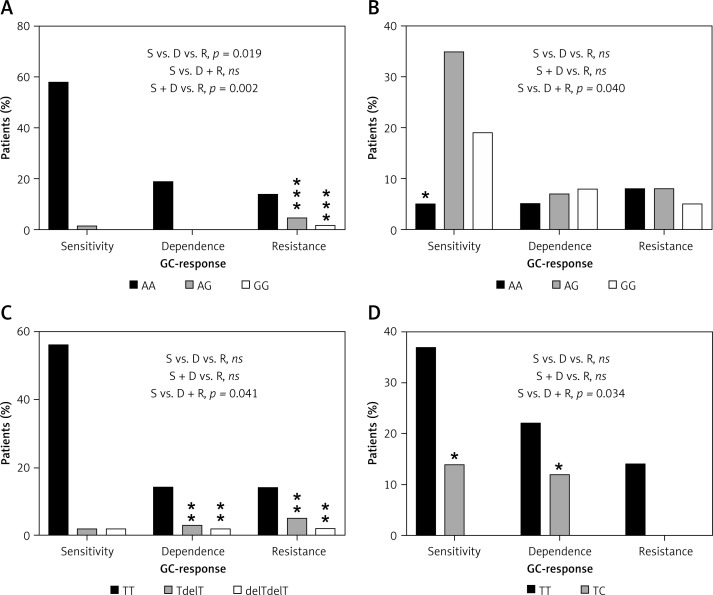
Figure 5.
Distribution of genotypes for significantly correlated variants: A – NR3C1, c.1088A>G, UC patients, B – FKBP5, c.241+6A>G, UC patients, C – MAPK14, c.306-7delT, UC patients, D – ABCB1, c.2685+49T>C, CD patients
ns – non-significant, *relevant genotypes for the GC-response type, p < 0.05, **p < 0.01, ***p < 0.001.

