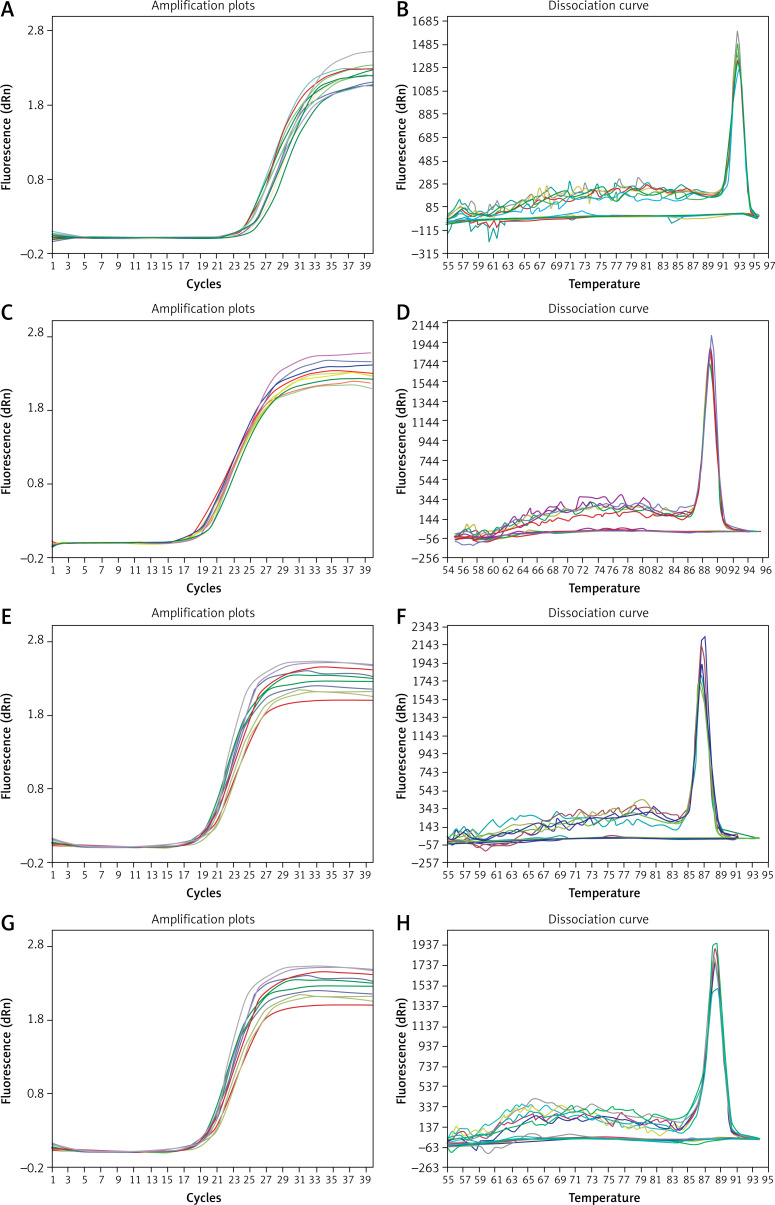
Figure 1.
Amplification and melting curves of Bcl-2, Bax, caspase-3 and β-actin. A – amplification curve of Bcl-2, B – melting curve of Bcl-2, C – amplification curve of Bax, D – melting curve of Bax, E – amplification curve of caspase-3, F – melting curve of caspase-3, G – amplification curve of β-actin, H – melting curve of β-actin

