
Fig. 2.
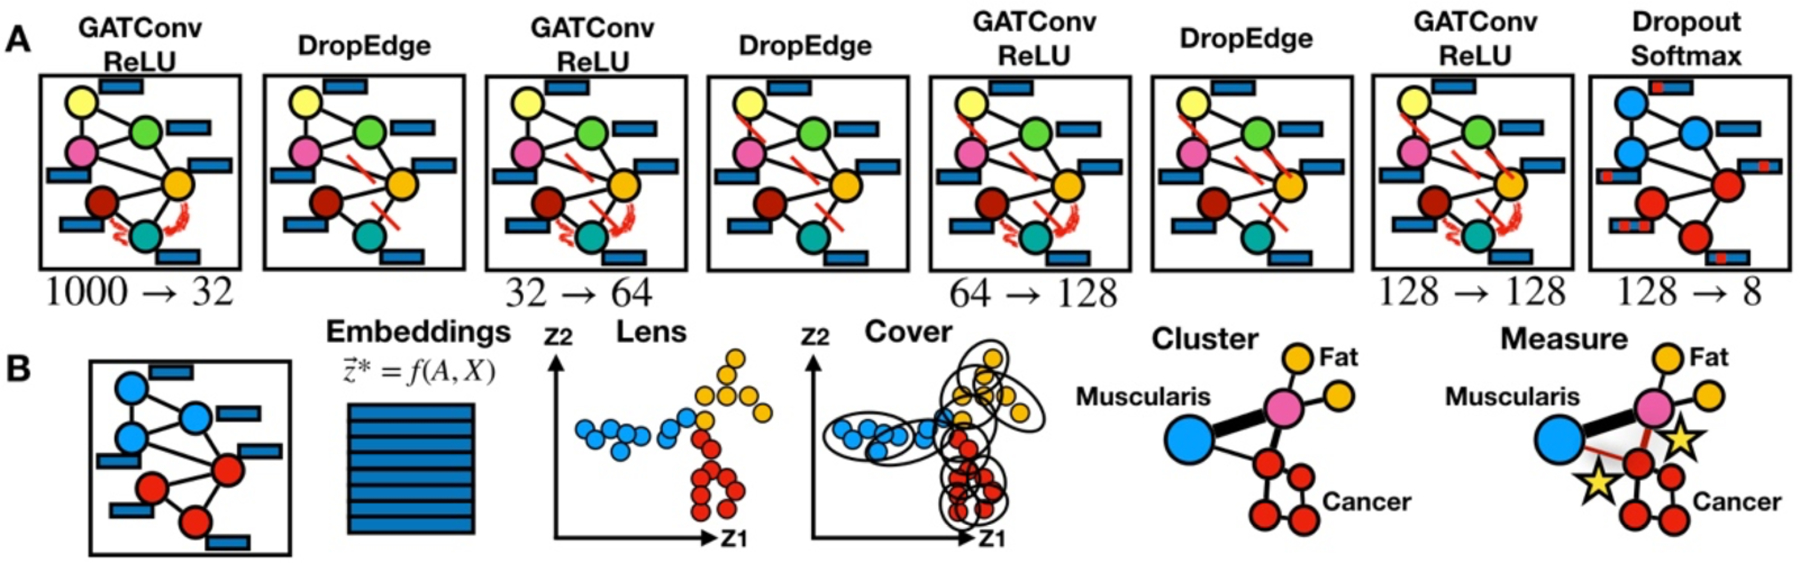
Methods: a) Neural network architecture for node classification experiment; 1000-d patch-level embeddings pass through graph attention convolutions, ReLU and DropEdge layers which alter dimensionality of patch embeddings while routing information from neighbors; attention between blue node and neighborhood is characterized using red curves; pruned edges are portrayed using red lines; b) once GNN classification model has been fit, GNN embeddings are extracted; lens function projects them to lower-dimensionality; patches are covered and clustered to reveal high-level measurable relationships between muscularis propria, fat and cancer