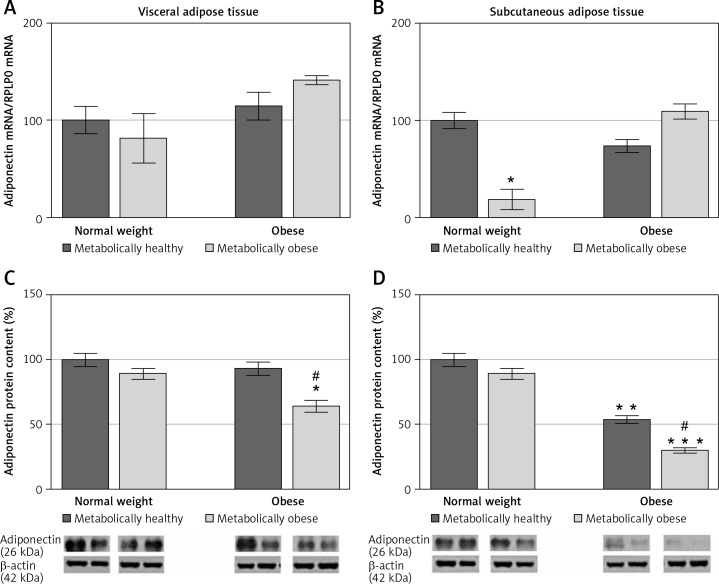
Figure 5.
mRNA and protein expression levels of resistin in the visceral (A, C) and subcutaneous adipose tissues (B, D) of metabolically healthy normal-weight, metabolically obese normal-weight, metabolically healthy obese, and metabolically obese (“at risk”) women. The protein content is expressed relative to that of a metabolically healthy normal-weight control, which was standardised to be 100%. The results of a representative example from three observations are shown. The data were quantified as described in the Materials and methods section. The values represent the mean ± SEM
*Comparison with metabolically healthy normal weight group, *p < 0.05, **p < 0.01, ***p < 0.001. #Comparison with corresponding metabolically healthy group, #p < 0.05, ##p < 0.01, ###p < 0.001.

