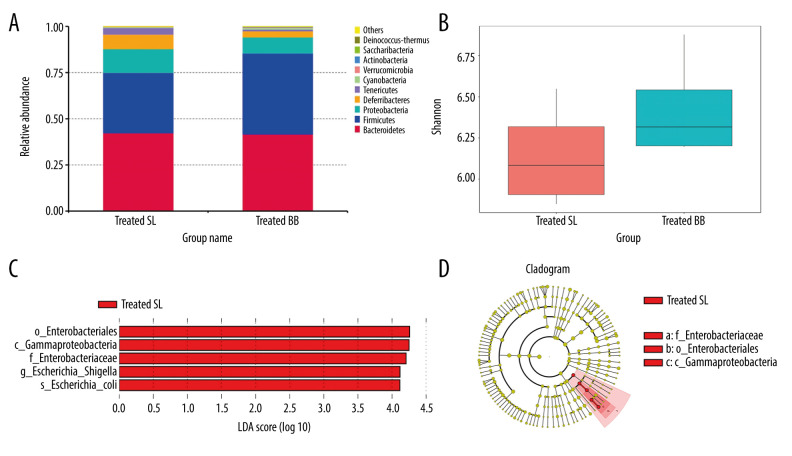
Figure 4.
Changes in the microbial communities in the treated group. (A) The top 10 most frequently observed bacterial phyla in the communities. Sequences that could not be classified into any known group were labeled “other.” (B) The Shannon diversity index of the Bifidobacterium bifidum-treated group was greater than that of the control group. (C) Different features in the control and B. bifidum-treated groups were identified using linear discriminate analysis effect size, with a local-density approximation value of 4.0. (D) Differences are represented by the color of the most abundant class.

