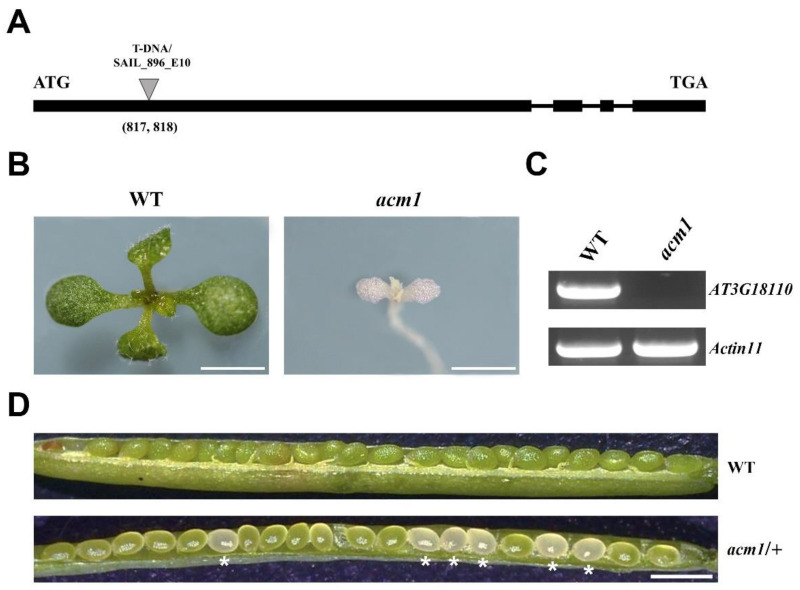
Figure 1.
Phenotype of the acm1 mutant. (A) Schematic diagram of the ACM1 gene. Exons and introns are indicated by black boxes and lines respectively. The T-DNA insertion by the triangle; ATG represents the initiation codon and TGA represents the stop codon. (B) Albino phenotype of the acm1 mutant. Ten-day-old plants were grown on 1/2 MS medium with sucrose. Scale bar: 3 mm. (C) Reverse transcription PCR analysis. RT-PCR was performed using specific primers for AT3G18110 and Actin 11 for 29 cycles for WT and acm1. (D) The ovules of heterozygous acm1/+ mutant silique. The asterisks indicate albino ovules. Scale bar is 1 mm.

