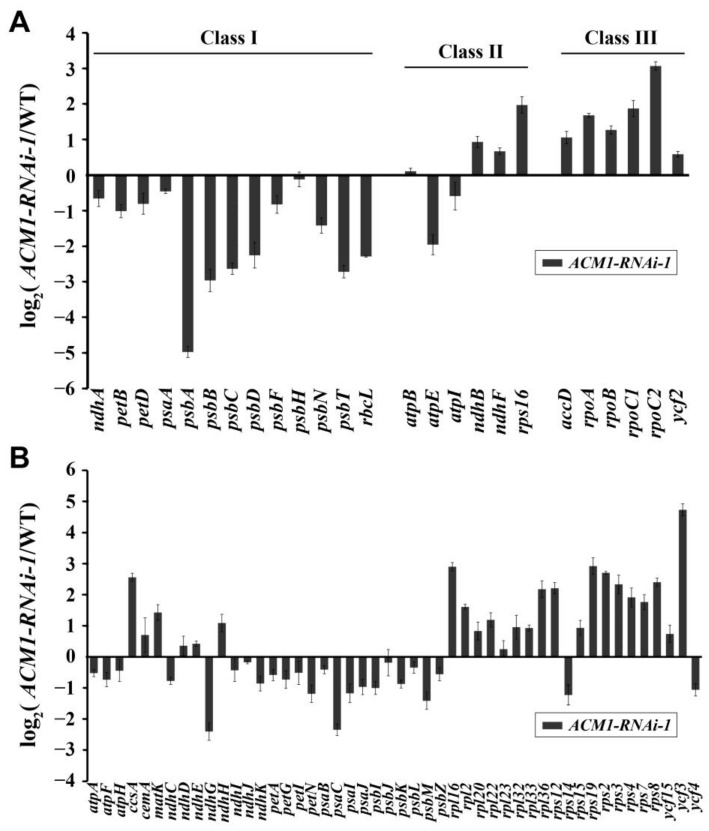
Figure 7.
Chloroplast gene expression in ACM1-RNAi-1 relative to the WT. (A) Transcript levels of chloroplast genes were measured by quantitative RT-PCR. Data are given as log2 of ACM1-RNAi-1/WT ratios from at least three independent experiments. (B) Transcript levels of not clearly classified chloroplast genes. Data are given as log2 of ACM1-RNAi-1/WT ratios from at least three independent experiments. RNA was extracted from 7-day-old seedlings cotyledons and reverse-transcribed.

