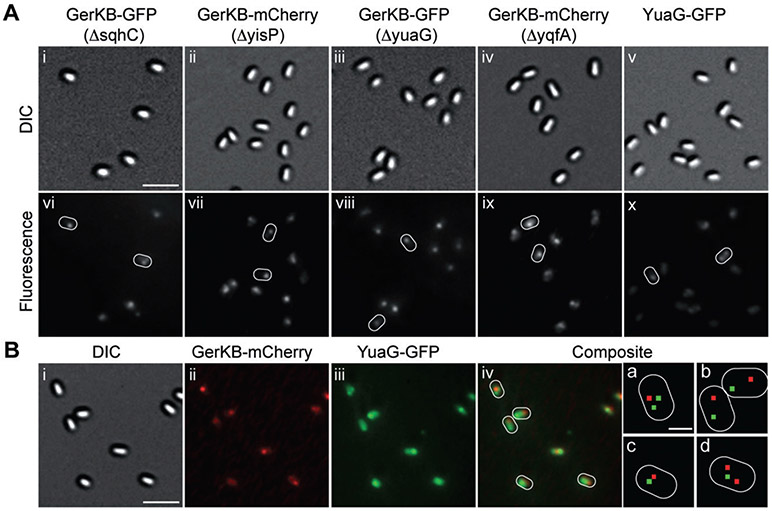
Fig. 7. Polyisoprenoids and flotillin homologues are not involved in clustering of germination proteins.
A. Panels show DIC and corresponding fluorescence images of spores expressing (strains carried both wild-type and fusion copies of the genes of interest): (i, vi) GerKB-GFP in a ΔsqhC background (KGB150); (ii, vii) GerKB-mCherry in a ΔyisP background (KGB152); (iii, viii) GerKB-GFP in a ΔyuaG background (KGB147); (iv, ix) GerKB-mCherry in a ΔyqfA background (KGB154); and (v, x) YuaG-GFP (KGB155); some spores in the fluorescence images are outlined in white. All fluorescence images are shown with the same intensity scale. The scale bar in panel (Ai) is 2 μm, and all panels are at the same magnification.
B. Panels show the DIC image (i), mCherry fluorescence image in red (ii), GFP fluorescence image in green (iii), and a composite of mCherry and GFP fluorescence images (iv) of spores expressing GerKB-mCherry + YuaG-GFP (strain KGB156). All fluorescence images in this figure were scaled such that the maximum fluorescence intensity of the 8-bit image was 254. Some spores are outlined in white and smaller panels (a,b) are magnified from the corresponding composite fluorescence images of these spores in which the red and green dots denote the locations of the maximum intensity pixels in each spore. The scale bar in panel (i) is 2 μm and panels (i–iv) are at the same magnification; the scale bar in the panel a is 0.5 μm and all panels (a–d) are at the same magnification.

