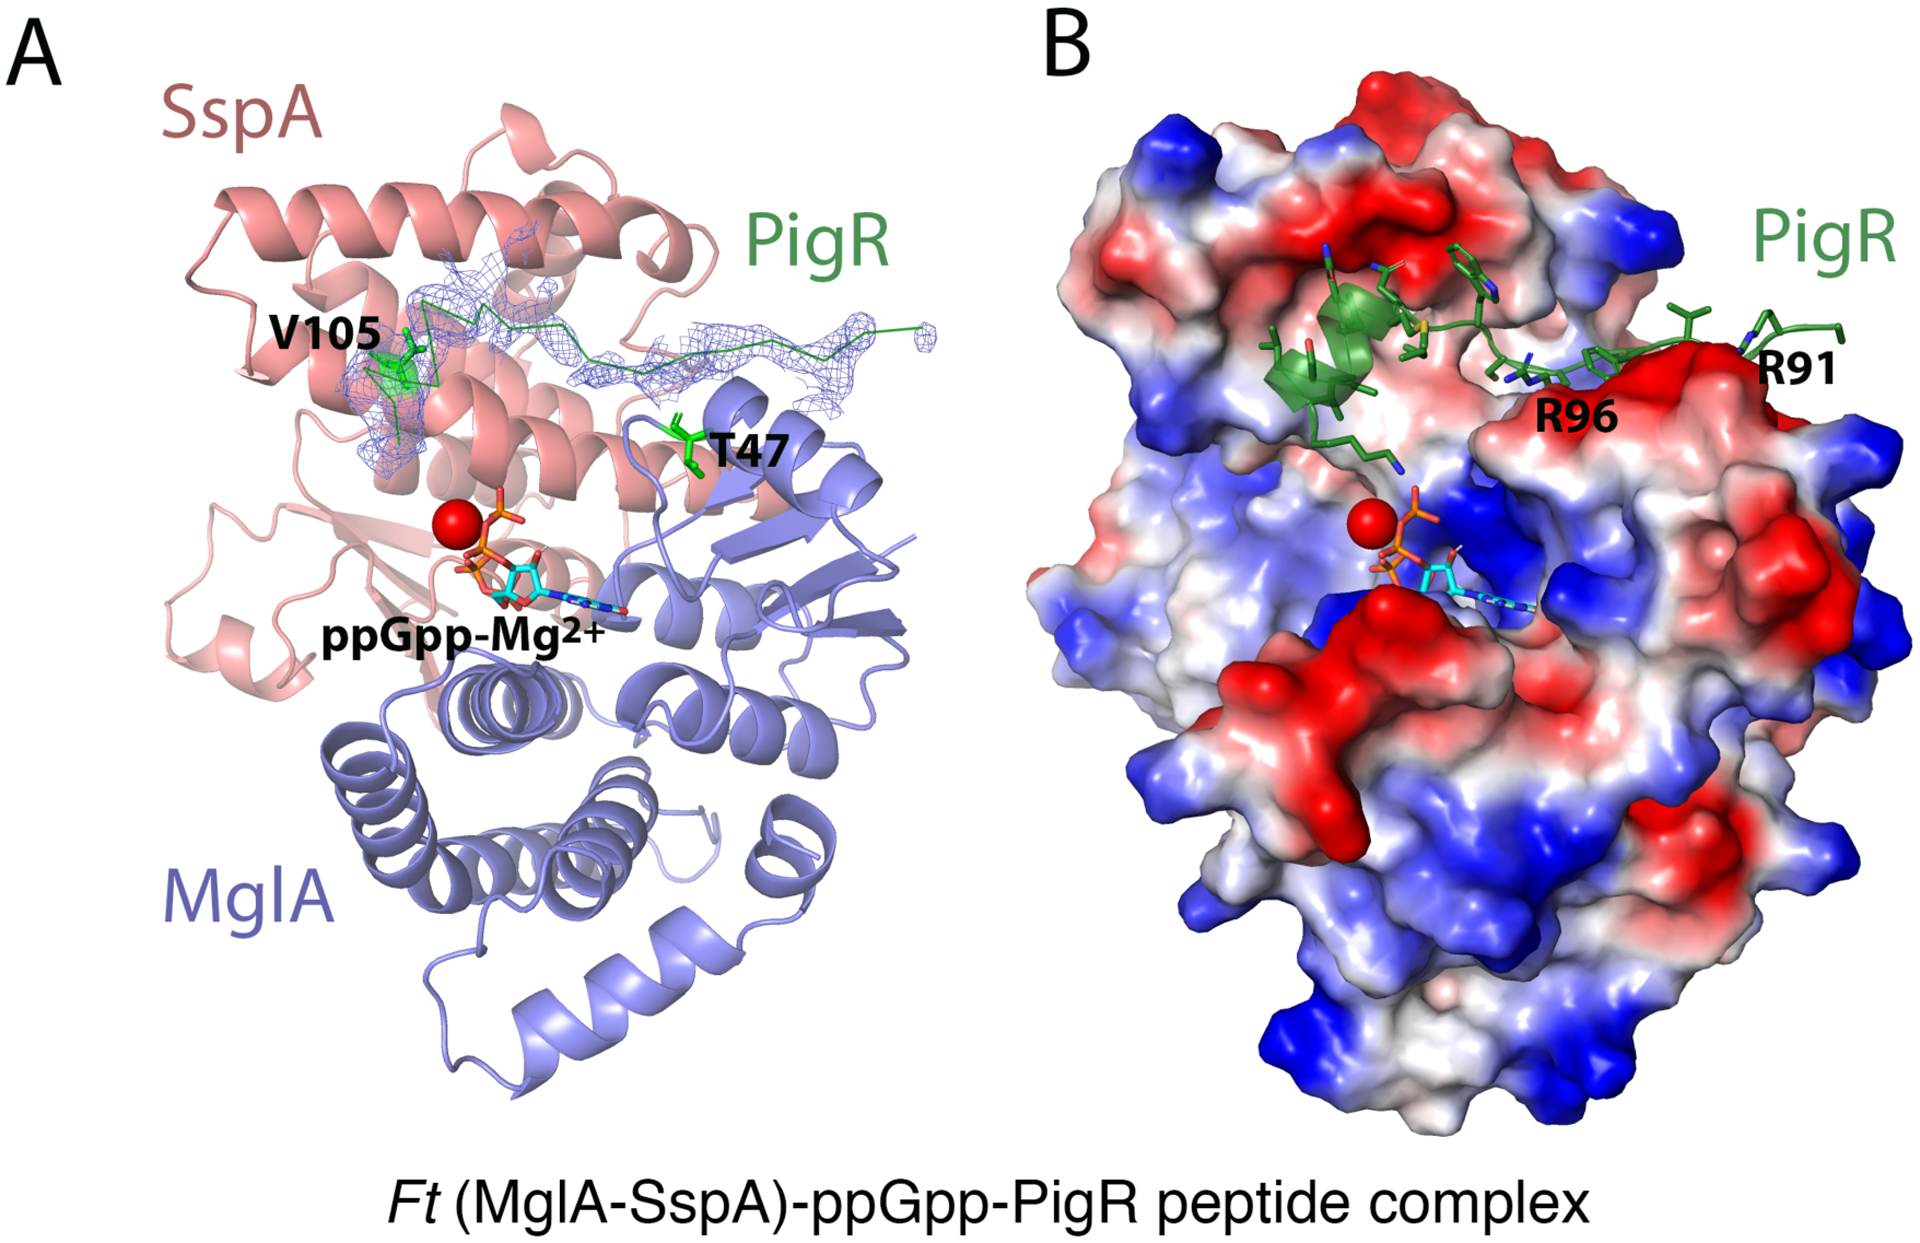
Figure 3. X-ray structure of (MglA-SspA)-ppGpp-PigR peptide complex.

A Ribbon diagram of MglA-SspA with 2Fo-Fc electron density (0.65 σ) shown before the PigR peptide was added. Shown also are the locations of SspA V105 and MglA T47 (green sticks). The PigR peptide is shown as a green ribbon, ppGpp as sticks and Mg2+ as a red sphere. B Electrostatic surface of MglA-SspA with the PigR peptide depicted as a green ribbon. Positive and negative regions are blue and red, respectively.
