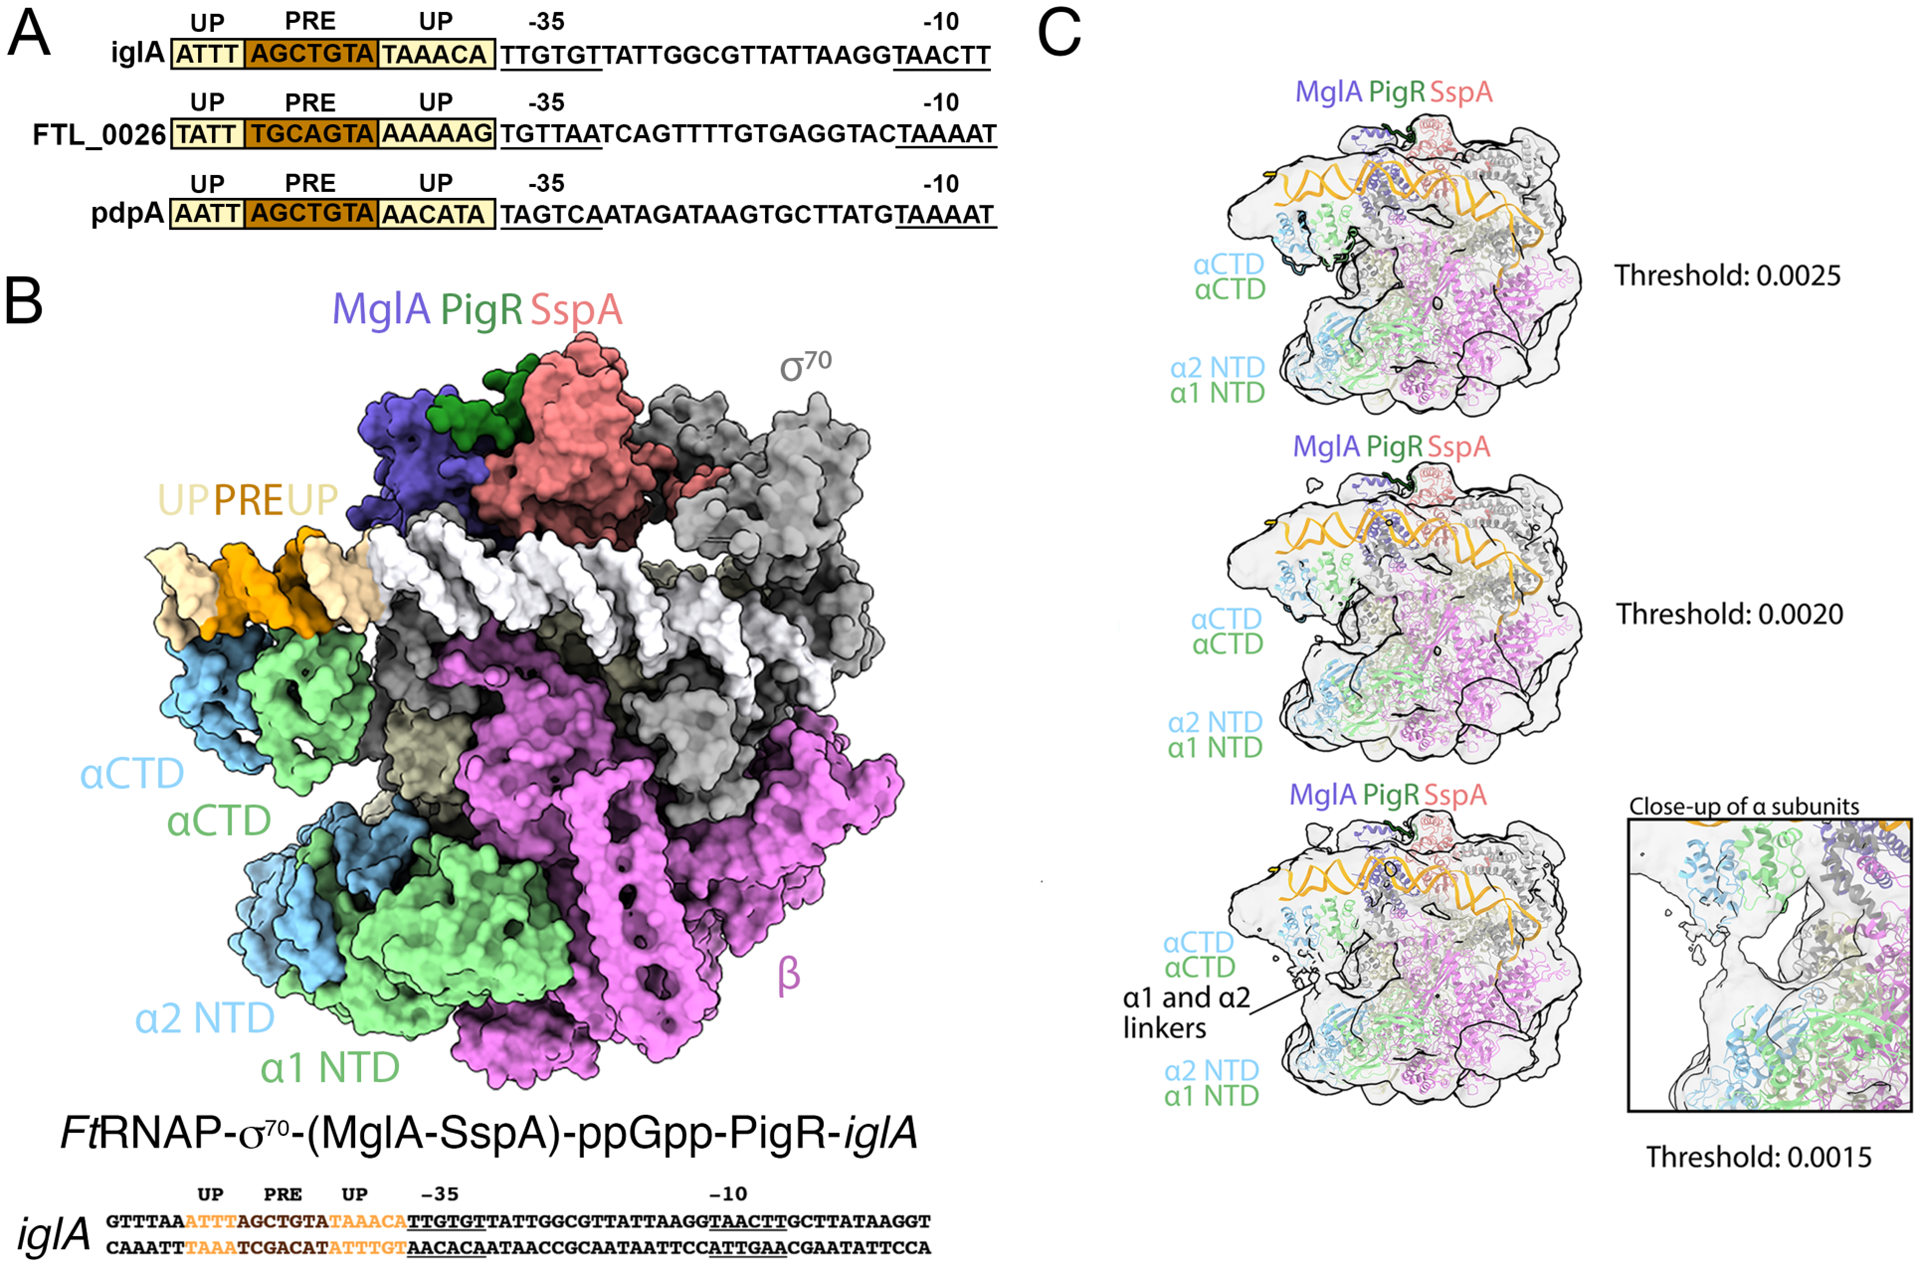
Figure 4. Cryo-EM structure of the FtRNAPs70-(MglA-SspA)-ppGpp-PigR-DNA complex.

A Cryo-EM structure of the FtRNAPσ70-(MglA-SspA)-ppGpp-PigR-DNA complex. The PigR C-tail is modeled from the crystal structure. Above the structure is the full promoter sequence used in the structure, with promoter elements labeled. B DNA sequences of PigR controlled genes showing just the promoter regions. −35 and −10 elements are indicated, PRE elements are colored brown and AT-rich UP elements are light yellow. C Images of the FtRNAPσ70-(MglA-SspA)-ppGpp-PigR-DNA density map at various contour levels. Right shows a close up of the linker region, which leaves ambiguous which NTD is linked to which CTD.
