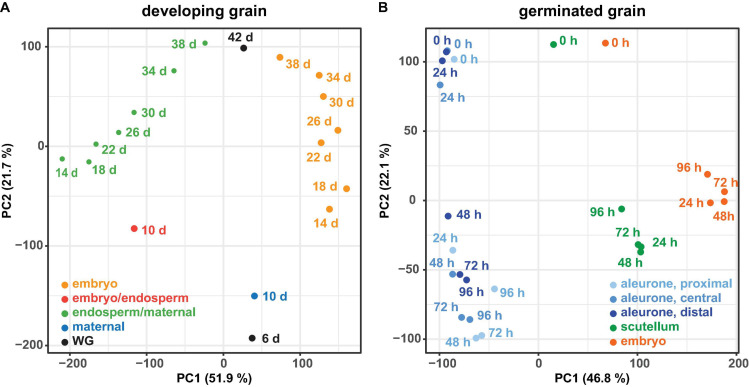
FIGURE 2.
Principal component analysis of RNA-seq data. For the RNA-seq data of the developing grain (A) and the germinated grain (B) a principal component analysis (PCA) was performed using the transcripts per million (TPM) values of all genes. For both experiments the samples are separated by tissue (principal component 1, PC1) and time (principal component 2, PC2).

