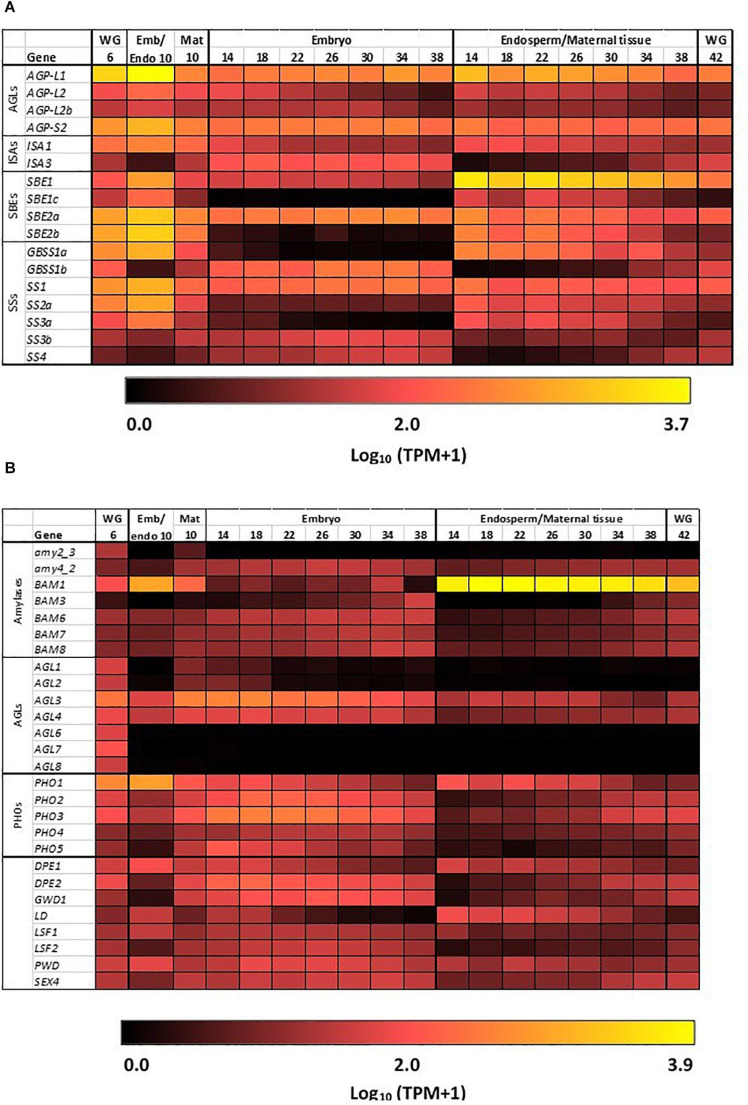
FIGURE 3.
Expression heat maps of genes involved in starch metabolism in developing barley grain. (A) Genes involved in starch synthesis and (B) genes involved in starch hydrolysis. Emb, embryo and scutellum; Endo, endosperm; Mat, maternal tissue; WG, whole grain. Numbers indicate days post-anthesis. The heat map colors are log10 TPM: for example, a value of 1.0 (very dark red = 10 TPM; 2.0 (bright red = 100 TPM; 3.0 (orange) = 1,000 TPM, while 3.7 (yellow) is approximately 5,000 TPM.

