
Figure 6. Central administration of MOTS-c recapitulates the phenotypes of mice with mild mitoribosomal stress in POMC neurons.
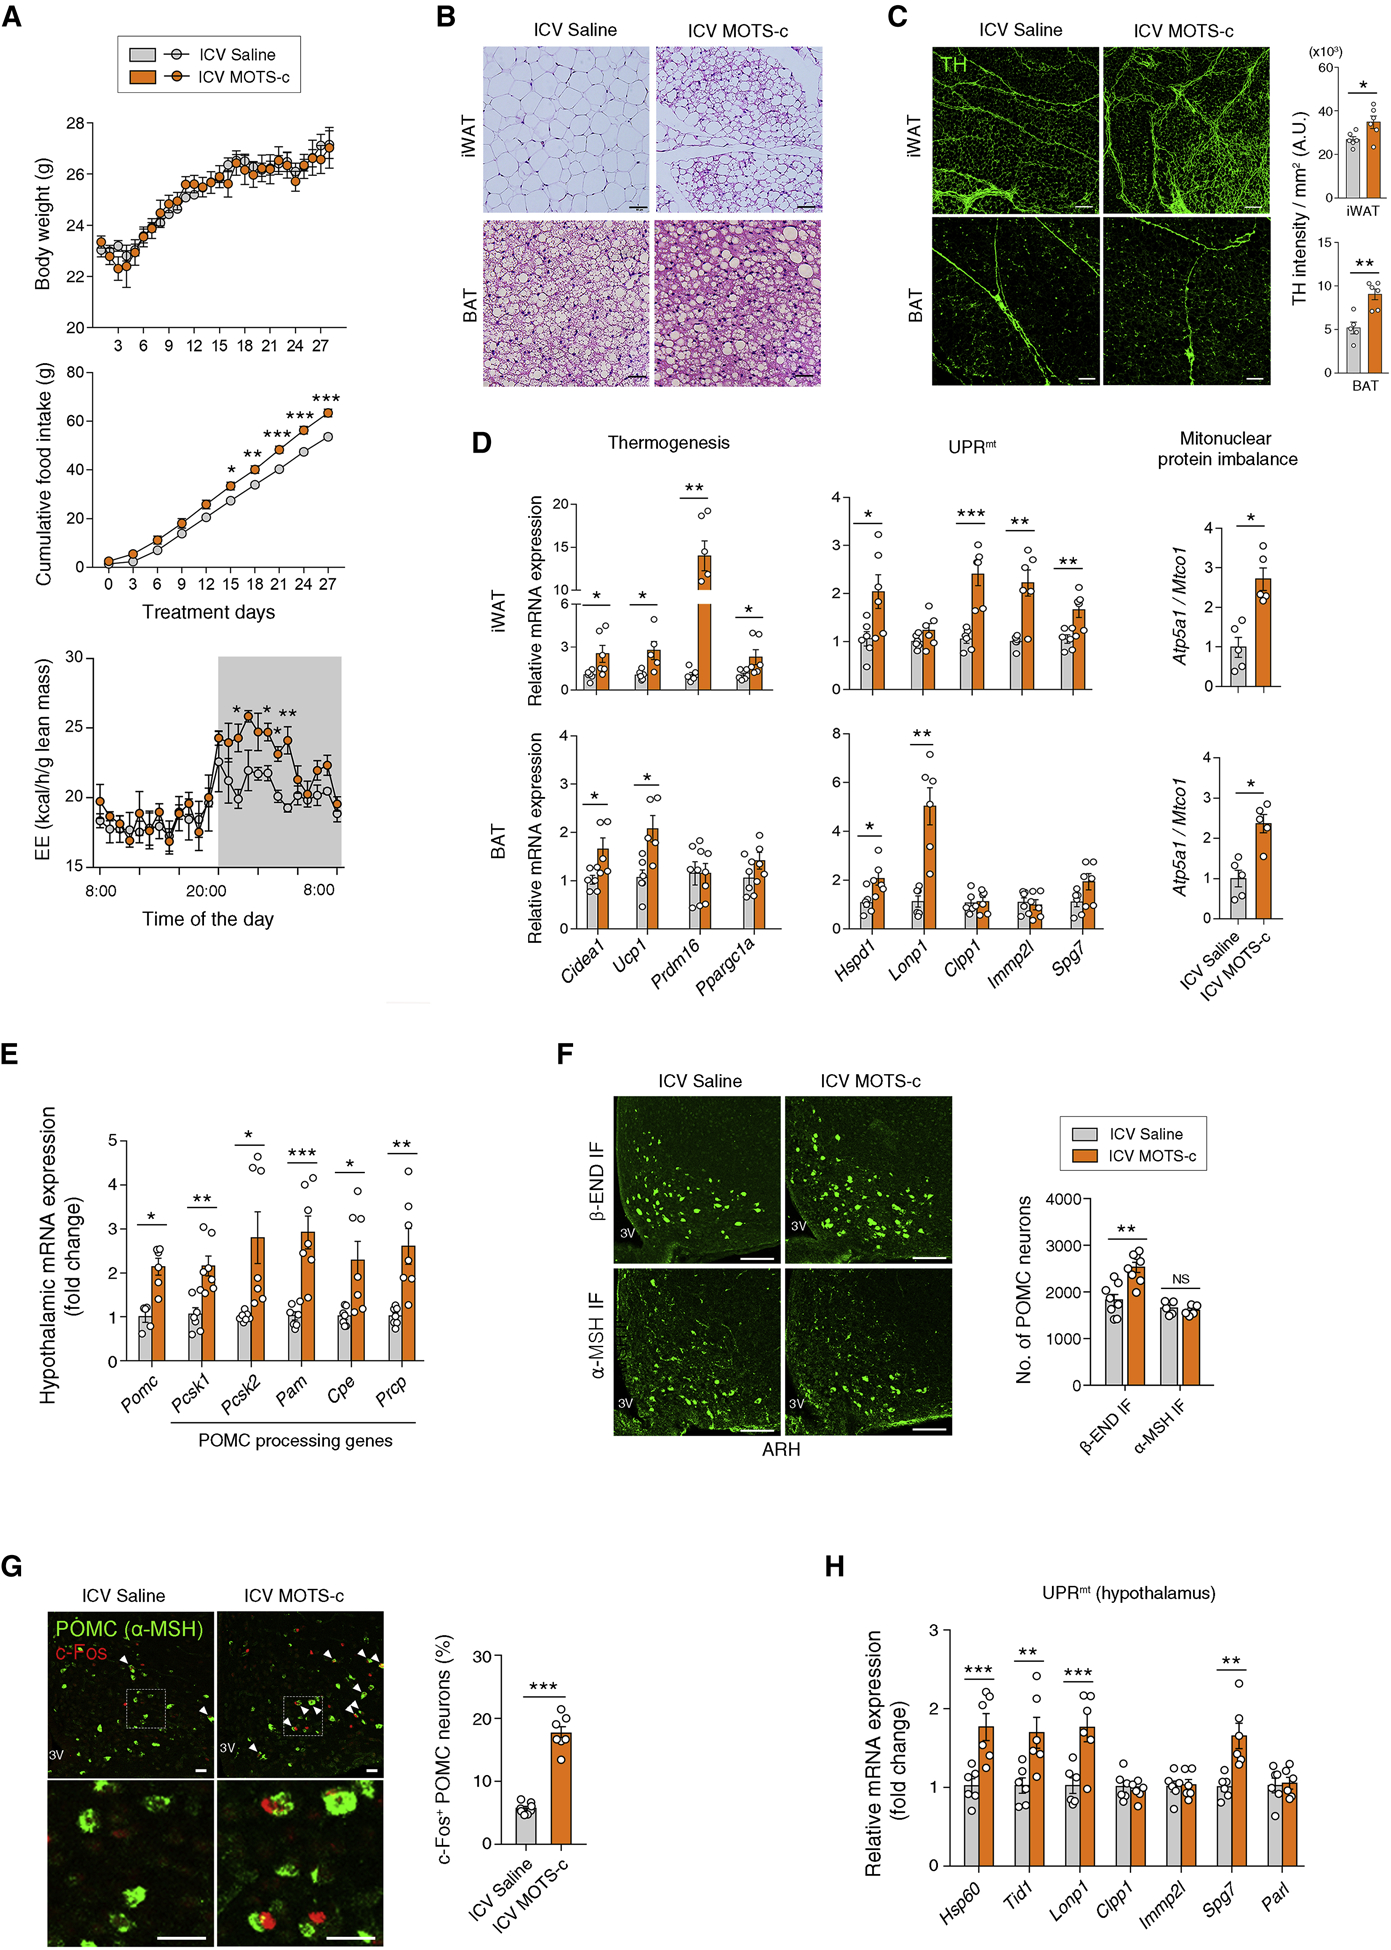
(A) Body weight, cumulative food intake, and energy expenditure during ICV infusion of MOTS-c in C57 mice (n = 6–9).
(B) ICV MOTS-c-treated mice show iWAT browning and smaller fat droplets in the BAT (n = 6). Scale bars, 50 μm.
(C, D) ICV MOTS-c-induces enhanced sympathetic innervation, thermogenesis, the UPRmt and a mitonuclear protein imbalance in the iWAT and BAT (n = 5–6). Scale bars, 200 μm (upper) and 50 μm (lower).
(E) Increased hypothalamic expression of Pomc and its processing enzymes in mice with ICV MOTS-c administration (n = 7).
(F) Increased numbers of the hypothalamic β-END+ neurons but no change in the α-MSH+ neuron numbers following ICV MOTS-c infusion (n = 5–8). Scale bars, 50 μm.
(G, H) Increase in the percentage of c-Fos+ POMC neurons and hypothalamic UPRmt gene expression in MOTS-c-treated mice (n = 6–8). Scale bars, 25 μm. Arrowheads indicate c-Fos+ POMC neurons.
Results are presented as a mean ± SEM. *p < 0.05, **p < 0.01, and ***p < 0.001 between indicated groups. NS, not significant. See also Figure S6