
Figure 4. Microglial activation after rmCHI is attenuated in Sarm1−/− animals.
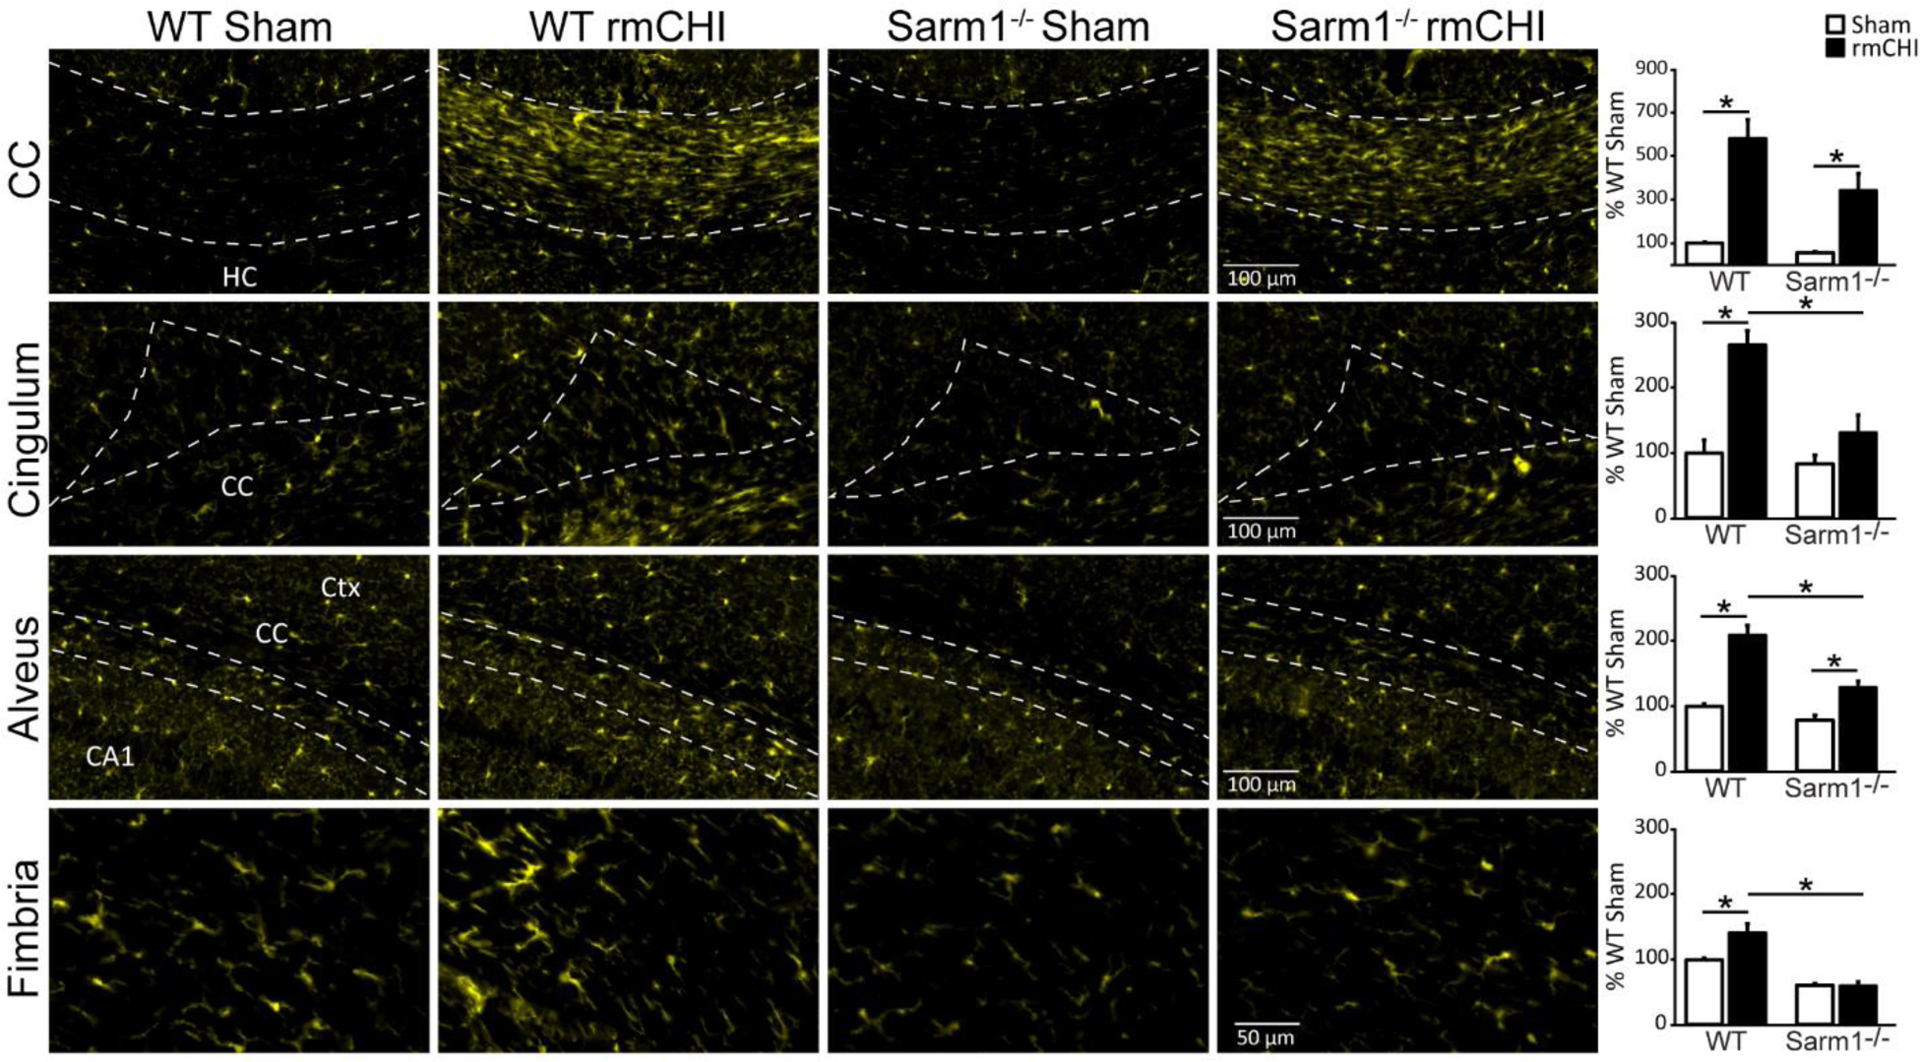
Representative high magnification images of Iba1 immunoreactivity from the white matter tracts (corpus callosum, cingulum, alveus, and fimbria of the fornix) of WT sham, WT rmCHI, Sarm1−/− sham, and Sarm1−/− rmCHI animals six months after injury or sham surgery. Summary data of the integrated fluorescent intensity of Iba1 immunoreactivity in the white matter tracts are shown on the far right. Data (mean ± SEM) are shown as the percent change relative to the wild-type sham group. *p < 0.05 in two-way ANOVA with Bonferroni’s multiple comparisons. CA1: Cornu Ammonis 1; CC: corpus callosum; Ctx: cortex; HC: hippocampal commissure.