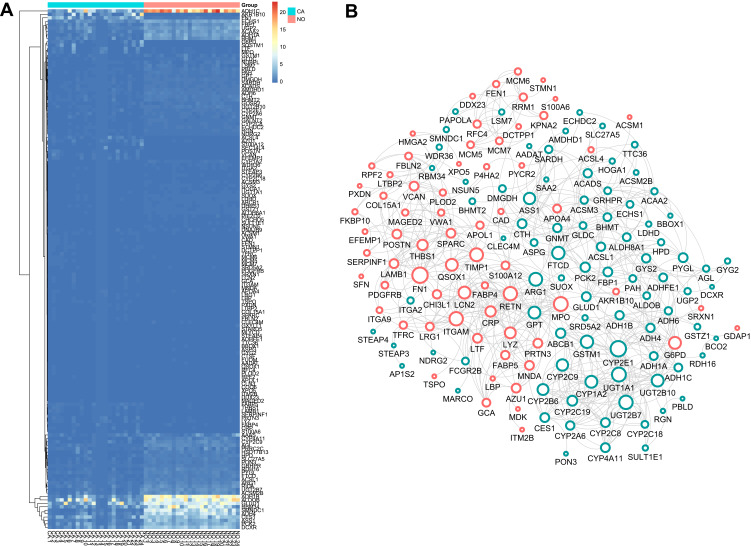
Figure 1.
DEGs identification and Construction of the PPI network. (A) The heatmap of DEGs between the LIHC and adjacent non-tumorous tissues. (B) Protein-protein interaction (PPI) network of 185 common DEGs. Upregulated DEGs were labeled in red and down-regulated were labeled in blue; p-value and fold change were log-transformed, and applied as the bolder with and node fill color; topological degree was used as the criteria for node size.

