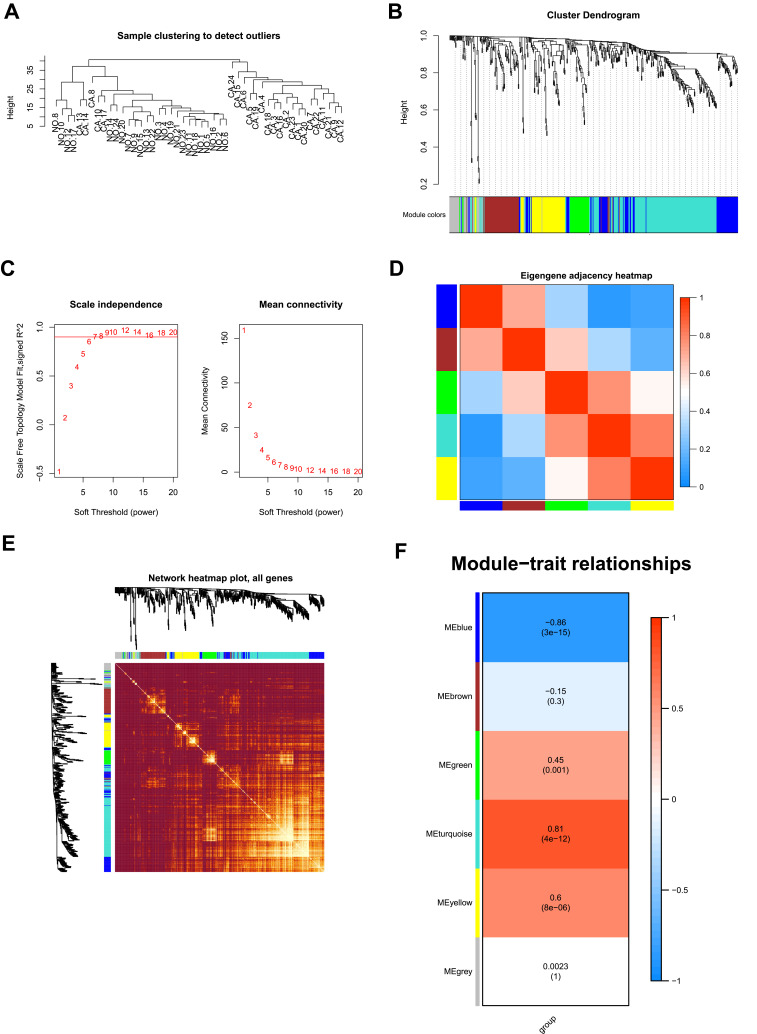
Figure 3.
WGCNA analysis of the LIHC proteome profiling. (A) Samples clustering were conducted to detect outliers between the LIHC and adjacent non-tumorous tissues; (B) Analysis of the scale-free topology model fit index for soft threshold powers (β); (C) Cluster dendrogram was generated by hierarchical clustering to show the modules of highly interconnected groups of genes between LIHC and adjacent non-tumorous tissues; (D) Interactive relationship analysis of co-expression genes. The light color indicates topological overlap, while the darker color indicates a high topological overlap. (E) The heatmap shows the eigengene adjacency. (F) Heatmap of the correlation between module eigengenes and clinical traits. P-value is shown in each color cell coded by the correlation between modules and traits (red indicates positive correlation; blue indicates negative correlation).

