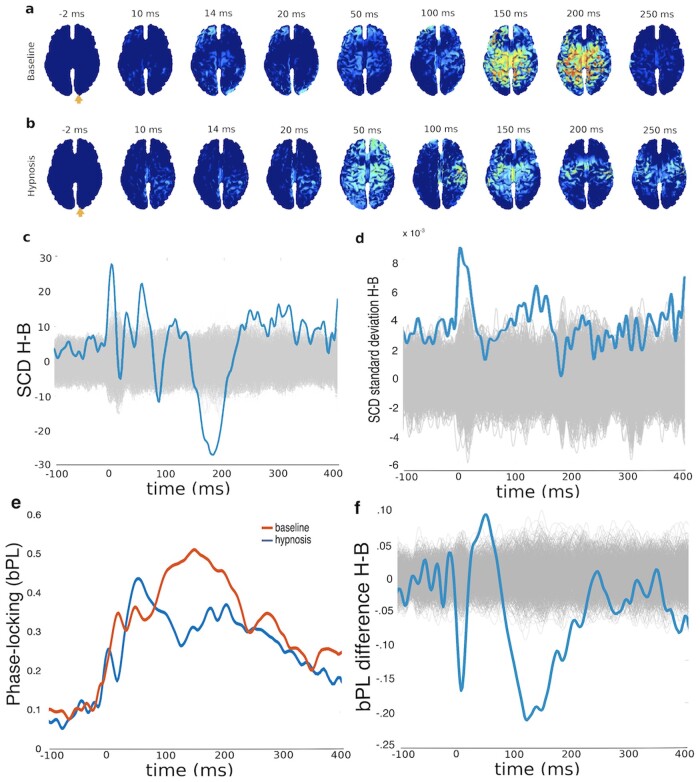
Figure 2.
Electrophysiological responses to TMS under hypnosis and (relaxed) baseline state. The spatiotemporal distribution of statistically significant, source-reconstructed. TMS-evoked activation (a) under baseline and (b) under hypnosis reveal clear differences. An orange arrow indicates the site of TMS stimulation. Panel (c) plots the difference in SCD (sum over all dipoles in Panels a and b) between hypnosis and baseline compared to a null distribution. Panel (d) plots the difference in standard deviations of SCD as a function of time compared to a null distribution. Panel (e) indicates the mean bPL factor in both hypnosis and baseline conditions, and Panel (f) compares the difference in bPL between conditions to a null distribution. Null distributions in Panels (c), (d), and (f) were arrived at by calculating 1000 random permutations, shown individually in light grey lines.

