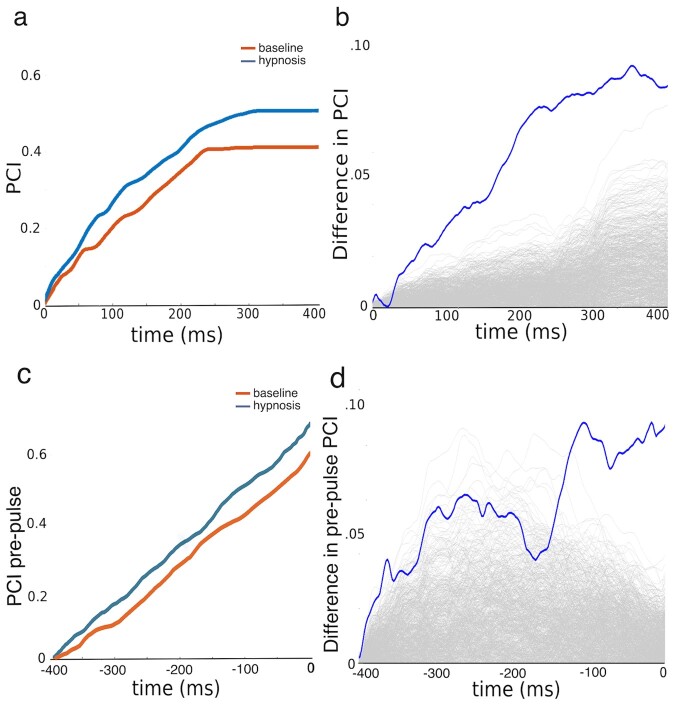
Figure 3.
Differences in PCI during hypnosis and baseline. Panel (a) plots cumulative PCI as a function of time under baseline and hypnosis following TMS perturbation. (b) Observed difference in PCI between hypnosis and baseline compared to a null distribution. (c) Difference in cumulative PCI before the TMS perturbation. (d) Observed difference in pre-pulse PCI compared to a null distribution. Null distributions were arrived at by calculating 1000 random permutations, shown individually in light grey lines in Panels (b) and (c).

