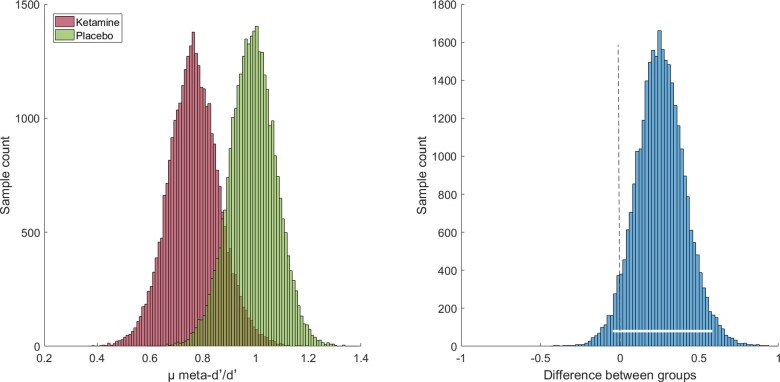
Figure 3.
Hierarchical Bayesian estimation of metacognitive efficiency (µmeta-d′/d′) in Study Phase I. Left panel: Group-level values for the ketamine group (red histogram) and the placebo group (green histogram). Right panel: Difference in group posteriors (in log units). The white bar indicates the 95% highest-density interval which narrowly overlaps with zero.

