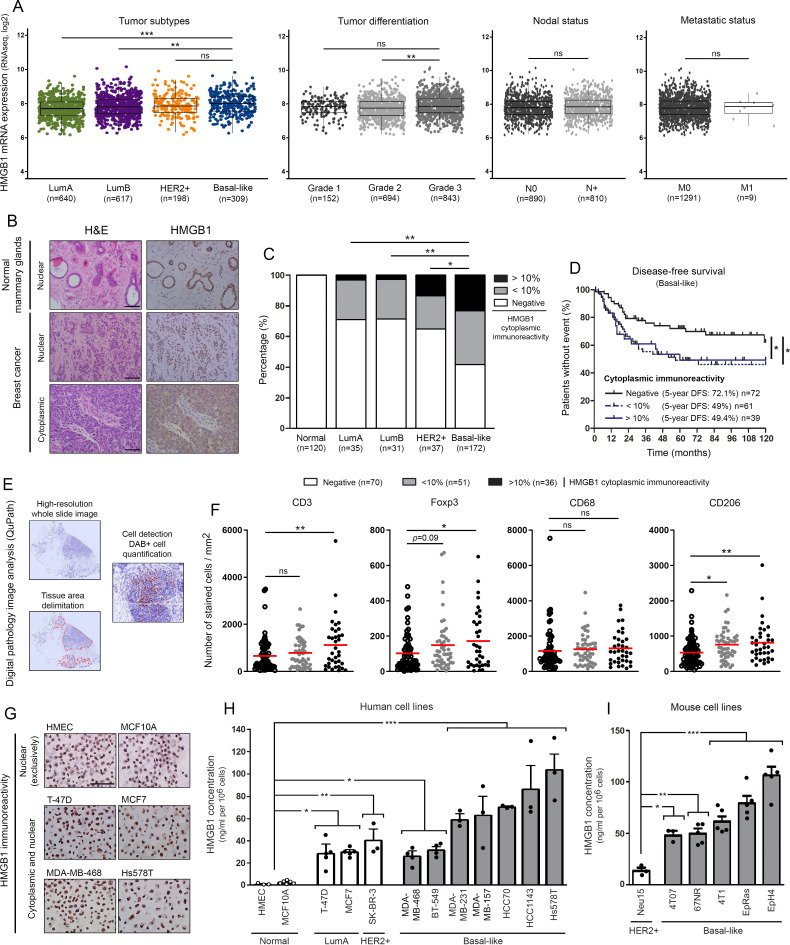
Figure 1.
HMGB1 is highly secreted by basal-like breast cancer cells and its tumor-specific cytoplasmic expression is associated with immune tolerance and poor outcome. (A) The METABRIC dataset was used for analyzing HMGB1 expression level in breast cancers according to molecular subtypes, histologic grades, nodal and metastatic statuses. (B) Representative pictures of normal mammary glands and breast cancers stained for HMGB1. Note the two distinct HMGB1 staining patterns detected in tumor specimens: nuclear versus cytoplasmic. (C) Semiquantitative evaluation of cytoplasmic HMGB1 immunoreactivity (negative, 0%–10% or >10% positive cells) in both normal mammary glands (n=120) and neoplasms (LumA, n=35; LumB, n=31; HER2+, n=37; basal-like, n=172). (D) Disease-free survival of patients treated for basal-like breast cancer according to cytoplasmic HMGB1 expression (negative, n=72; 0%–10%, n=61; >10%, n=39). This latter parameter was clearly found to be an independent prognostic factor. (E) Illustration of the different steps for DAB-positive cell quantification using computerized image analysis (QuPath). (F) CD3+, Foxp3+, CD68+ and CD206+ cell infiltrations in microenvironment of basal-like breast tumors. Whereas the global number (CD68+) did not significantly change, an increased density of CD206+ M2 macrophages was detected in cytoplasmic HMGB1-positive cancers. A similar increase was also reported with Foxp3+ Treg lymphocytes. the number of positive cells was reported to tumor area (mm2). (G) Representative examples of normal (HMEC and MCF10A) and malignant cells (LumA: T-47D and MCF7; basal-like: MDA-MB-468 and Hs578T) stained for HMGB1. Note the exclusive nuclear immunoreactivity displayed by normal mammary cells. Secretion/release of HMGB1 analyzed by ELISA in (H) human and (I) mouse cell culture supernatants. High concentrations were especially detected in cell cultures derived from triple negative/basal-like tumors. The means±SEM (plus each individual data point) for at least three independent experiments are represented. The scale bar represents 100 µm. Asterisks indicate statistically significant differences (*p<0.05; **p<0.01; ***p<0.001). P values were determined using one-way ANOVA followed by Bonferroni post-test (A), unpaired t-test (A), χ2 test (C), log-rank (Mantel-Cox) test (D) and one-way ANOVA followed by Dunnett’s multiple comparison post-test (F, H, I). ANOVA, analysis of variance; HMGB1, high-mobility group box 1; METABRIC, Molecular Taxonomy of Breast Cancer International Consortium.

