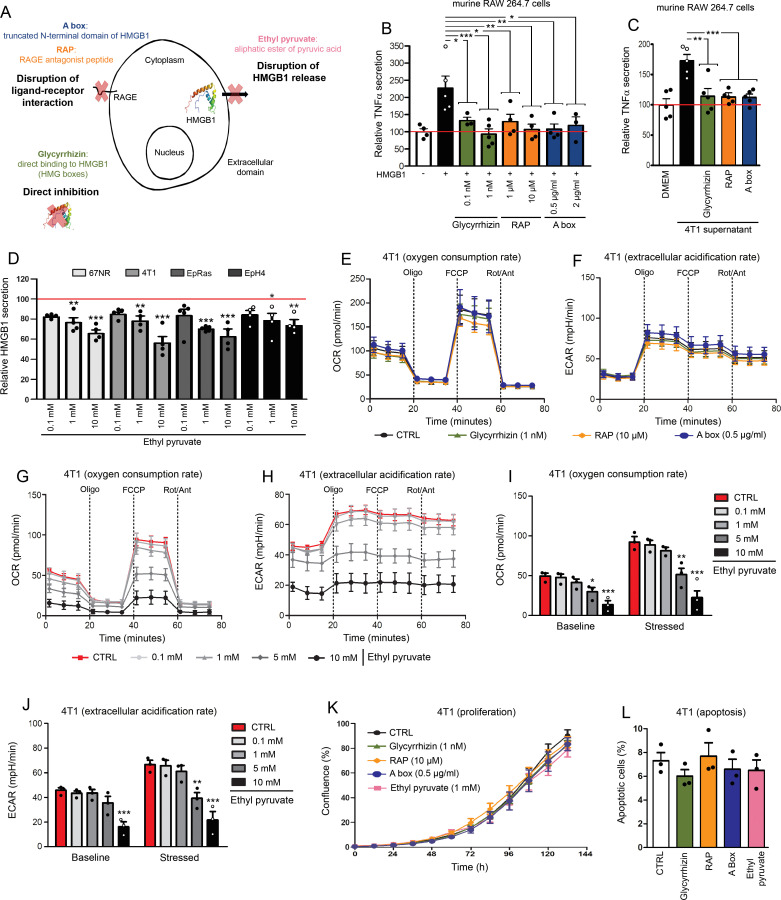
Figure 2.
Glycyrrhizin, RAP, A box and EP exert efficient neutralizing effects on extracellular HMGB1 without altering tumor cell proliferation and apoptosis/necrosis. (A) Schematic representation of different modes of inhibition for extracellular HMGB1. Mouse RAW 264.7 cells were stimulated with recombinant HMGB1 (B) or conditioned media from 4T1 basal-like breast cancer cells (C) in the absence or presence of glycyrrhizin, RAP or a box (several concentrations were tested). Note the significant decrease of HMGB1-induced TNFα secretion when HMGB1 inhibitors were added in the cell cultures, indicating their efficient neutralizing effect. (D) EP was directly added in the culture medium of 4 different mouse basal-like breast cancer cell lines (4T1, 67NR, EpRas and EpH4). Forty-eight hours later, HMGB1 concentrations were determined by ELISA and the ability of EP to inhibit HMGB1 release in a dose-dependent manner was highlighted. (E) Oxygen consumption rate (OCR) and (F) extracellular acidification rate (ECAR) in 4T1 cells in the absence or presence of glycyrrhizin (1 nM), RAP (10 µM) and a box (0.5 µg/mL) were determined using Seahorse extracellular flux analyzer. No modification of OCR/ECAR was detected with these three HMGB1 inhibitors. (G) OCR and (H) ECAR in 4T1 cells following EP addition (concentration range: 0.1–10 mM). Histograms representing OCR (I) and ECAR (J) before (baseline) and after (stressed) oligomycin and FCCP addition in the absence or presence of EP. Both OCR and ECAR were strongly decreased with 5 and 10 mM EP. No significant change was detected with lower concentrations (0.1–1 mM). (K) Cell proliferation and (L) apoptosis of mouse 4T1 cells cultured without or with HMGB1 inhibitors (glycyrrhizin (1 nM), RAP (10 µM), a box (0.5 µg/mL) and EP (1 mM)) were determined using IncuCyte live cell analyzing system and annexin V-propidium iodide staining assay, respectively. No significant change was reported. The means±SEM (plus each individual data point) for at least three independent experiments are represented. Asterisks indicate statistically significant differences (*p<0.05; **p<0.01; ***p<0.001). P values were determined using one-way ANOVA, followed by Dunnett’s multiple comparison post-test (B, C, D, I, J, K, L). ANOVA, analysis of variance; ECAR, extracellular acidification rate; EP, ethyl pyruvate; HMGB1, high-mobility group box 1; RAGE, receptor for advanced glycation endproducts; RAP, RAGE antagonist peptide; TNFα, tumor necrosis factor-α.

