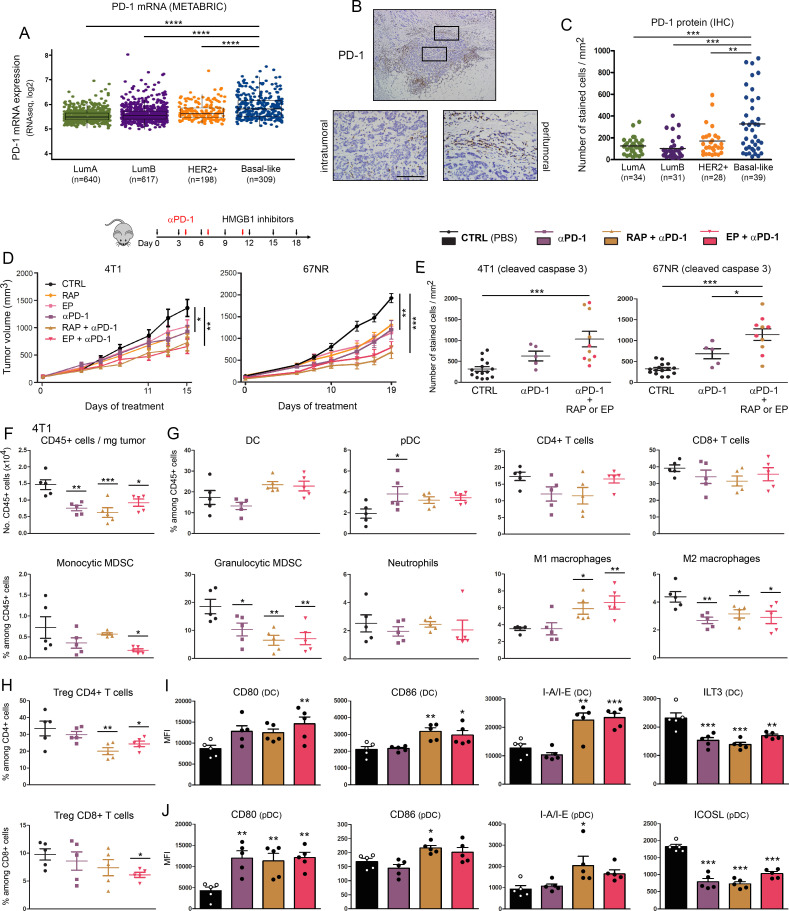
Figure 4.
Extracellular HMGB1 blockade enhances anti-PD-1-induced inhibition of tumor growth in vivo. (A) PD-1 mRNA expression (PDCD1 gene) in the four major molecular subtypes of breast cancer was determined using the METABRIC public dataset. (B) Representative example of breast cancer stained for PD-1. Positive cells were observed in the epithelial component of the tumor as well as in the stroma surrounding cancer cells. (C) PD-1+ cell infiltration within tumor microenvironment was determined by computerized counting. Each point represents the number of positive cells/mm2 for one independent tumor specimen. (D) Mouse breast cancer cells (4T1 and 67NR) were orthotopically injected into the mammary fat pad of immunocompetent BALB/c mice. Anti-PD-1 antibody was tested alone (i.p. injection of 200 µg at days 4, 7 and 11) and in combination with HMGB1 inhibitors (RAP (10 µM/kg) and EP (1 mM/kg), treatment at 3 day intervals). In parallel, the anticancer efficacy of these combination regimens was also compared with that displayed by each individual HMGB1 inhibitor used in monotherapy. The mean tumor volumes±SEM are represented. (E) The apoptotic cancer cells (cleaved caspase 3+) were detected by immunohistochemistry and quantified using QuPath software. The number of positive cells was reported to tumor area (mm2). (F) The total number of (CD45+) immune cells per milligram of tumor was determined in the different treatment groups. (G) Scatter dot plots illustrating the percentage of each individual immune cell population (DC, PDC, CD4+ and CD8+ T cells, monocytic and granulocytic MDSC, neutrophils, M1 and M2 macrophages) among CD45+ cells in both control and treated groups. Reduced densities of granulocytic MDSC as well as an increase of M1 macrophages were especially observed in case of combination therapy. The intratumoral immune cells were analyzed in five mice per condition. (H) Scatter dot plots showing the percentage of tumor-infiltrating Treg (Foxp3+) CD4+ and CD8+ cells among total CD4+ and CD8+ populations in the different treatment groups. the activation status of DC (I) and pDC (J) was determined by flow cytometry. the expression of several surface markers (CD80, CD86, I-A/I-E, ILT3 and ICOSL) was analyzed. Data represent the mean fluorescent intensity (MFI)±SEM of 5 independent experiments in each group (each individual data point is shown). The scale bar represents 100 µm. Asterisks indicate statistically significant differences (*p<0.05; **p<0.01; ***p<0.001; ****p<0.0001). P values were determined using one-way ANOVA followed by Bonferroni post-test (A, C, E) or Dunnett’s multiple comparison post-test (D, F, G, H, I, J). ANOVA, analysis of variance; DC, dendritic cell; HMGB1, high-mobility group box 1; METABRIC, Molecular Taxonomy of Breast Cancer International Consortium; MDSC, myeloid-derived suppressor cells; pDC, plasmacytoid DC; RAP, RAGE antagonist peptide.

