
Figure 1.
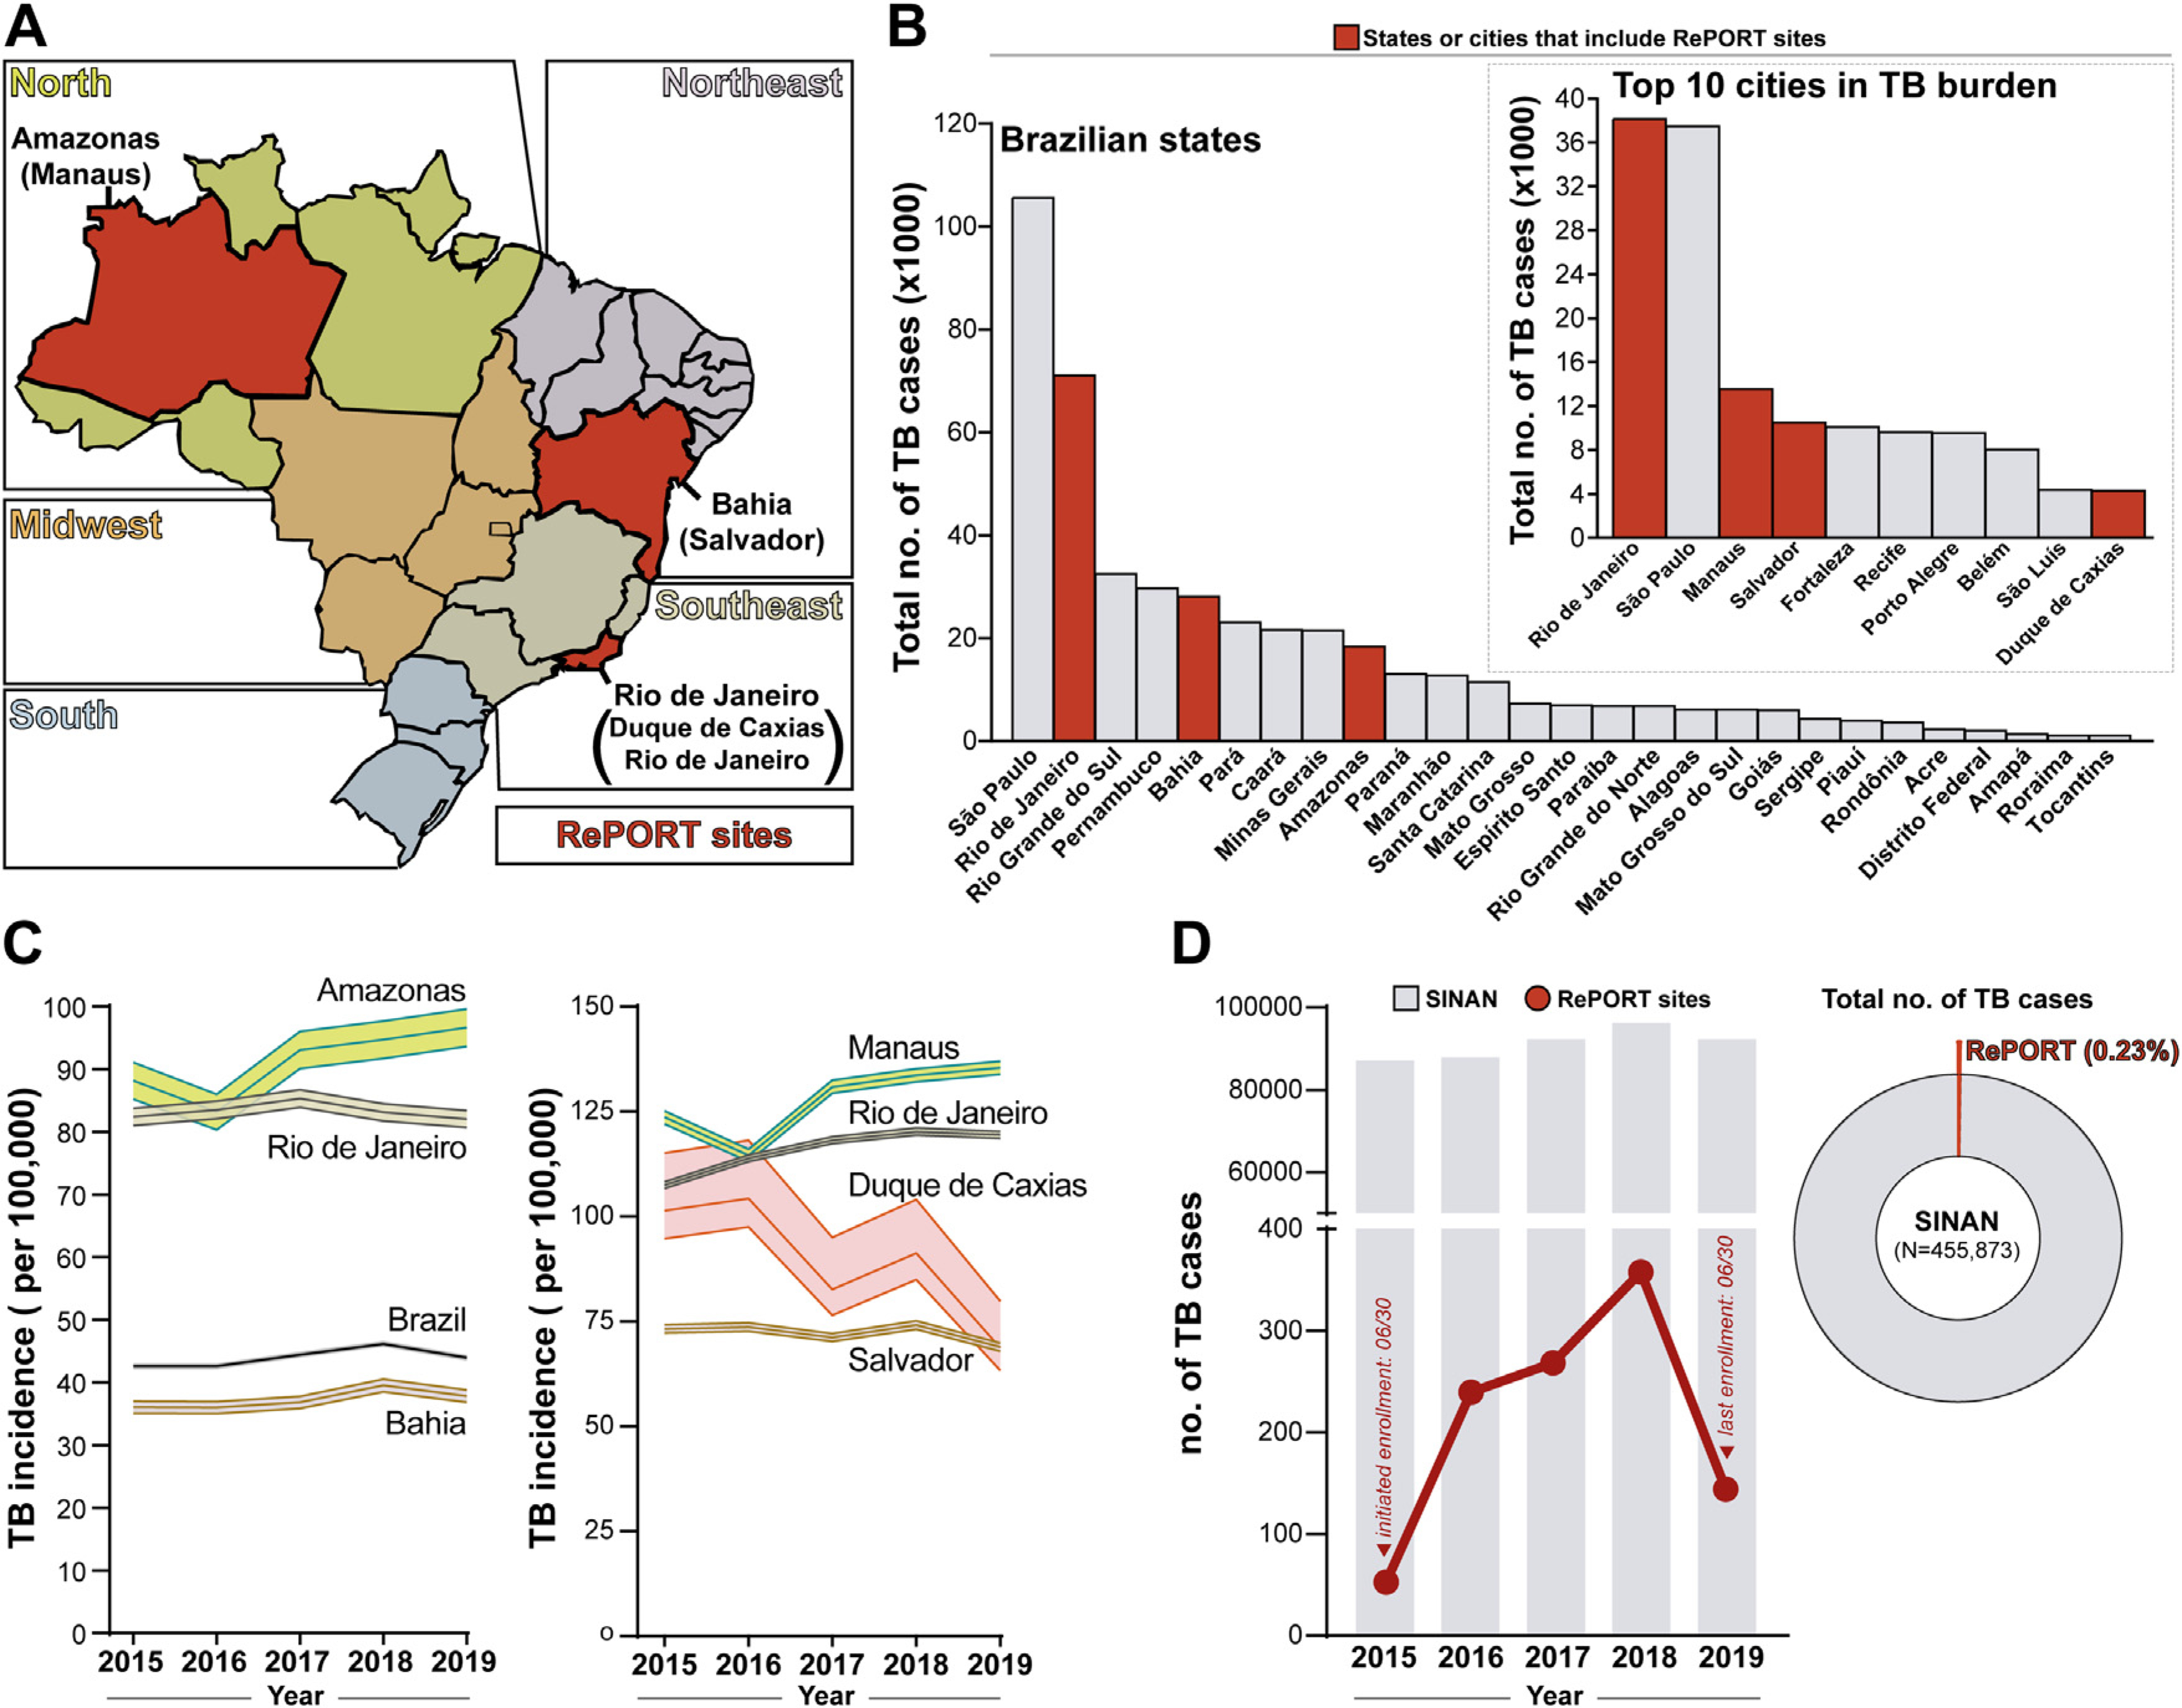
OverView of tuberculosis epidemiology in Brazil (2015–2109).
(A) Political map of Brazil shows the different 26 Brazilian states and one federal district colored according to the 5 macroregions (geopolitical subdivision). The states that include RePORT research centers are displayed in red. (B) Total number of tuberculosis cases reported in each Brazilian state, between 2015 and 2019. The states that include RePORT research centers are indicated by red bars. The upper right panel shows the total number of tuberculosis cases between 2015 and 2019 in the top 10 Brazilian cities with the highest number of tuberculosis cases reported within the study period. The cities where RePORT has research centers are highlighted by red bars. (C) Tuberculosis incidence (per 100,000 person-years) for the years 2015–2019, in Brazil the states (left panel) or in the cities (right panel) that host RePORT sites are shown. Data represent incidence and 95% confidence interval. Data were obtained from the National Plan for the End of Tuberculosis as a Public Health Problem (Plano Nacional pelo Fim da Tuberculose como Problema de Saúde Pública) (Ministério da Saúde do Brasil, 2017) (D) Total number of TB cases reported by the Brazilian Notification Information System (SINAN; gray bars) and by RePORT sites (red dots and connecting lines), in the study period. Right panel shows a donut pie chart illustrating the percentage that the TB cases recruited in the RePORT Brazil protocol represents among the total number of cases reported in SINAN between 2015 and 2019.
Abbreviations: TB: Tuberculosis, RePORT: Regional Prospective Observational Research for Tuberculosis, and SINAN: Sistema de Informação de Agravos de Notificação.