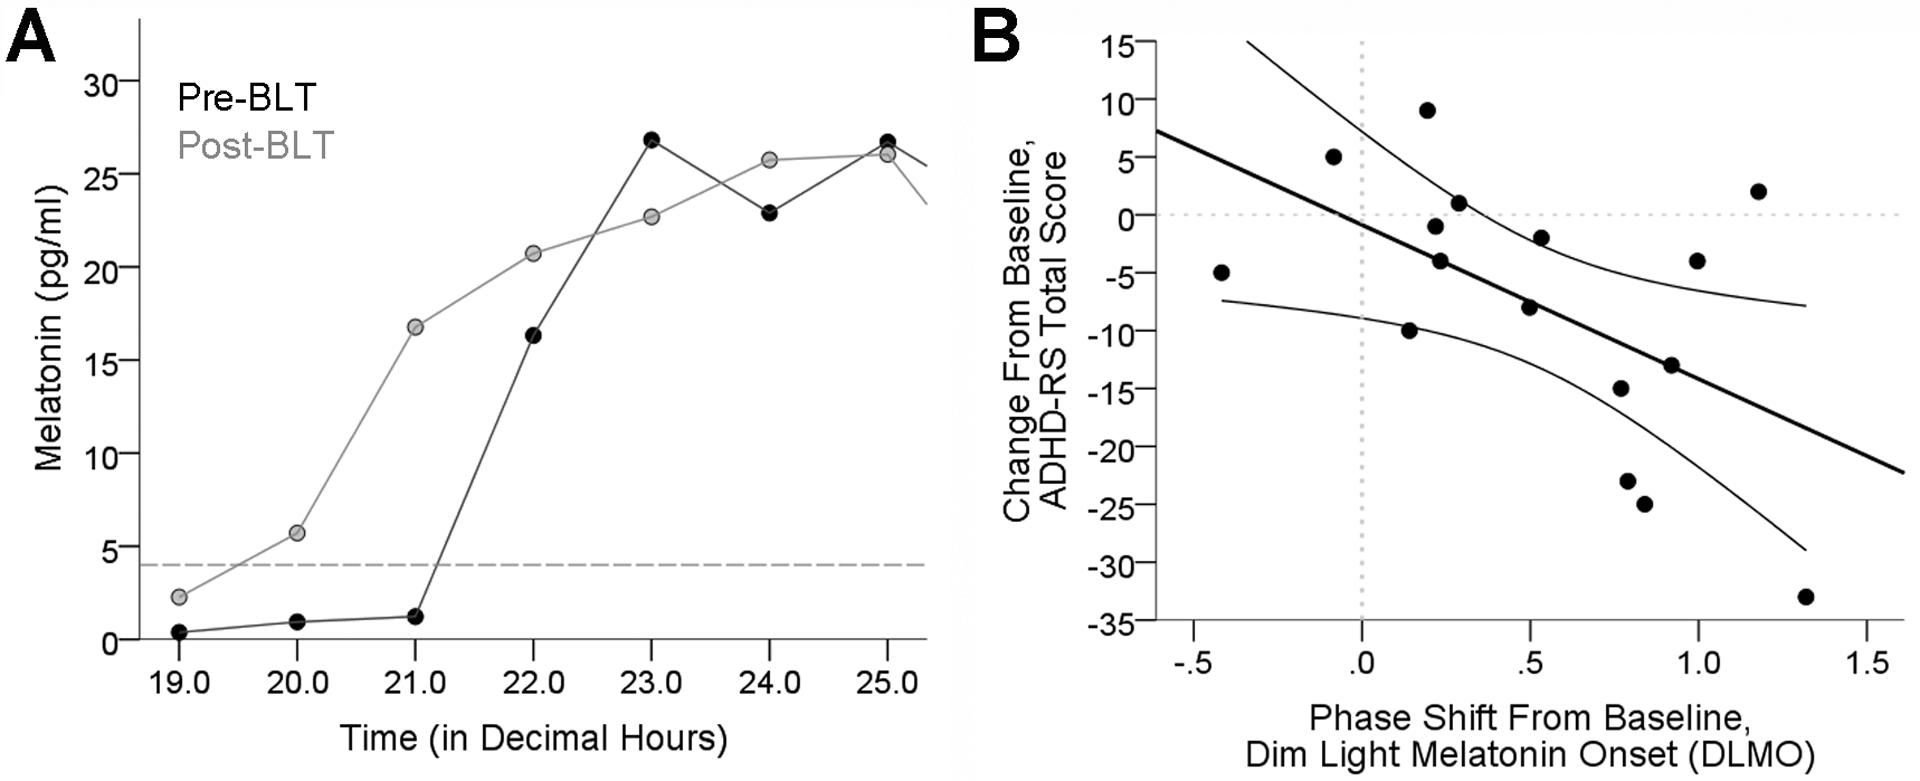
Figure 2.

A) Chart showing time of DLMO Pre-BLT and Post-BLT for a representative participant. DLMO was determined for each participant according to the linear interpolation procedure described in the Methods. B) Chart demonstrating a significant association between the DLMO phase shift from baseline and corresponding change in ADHD-RS total score.
