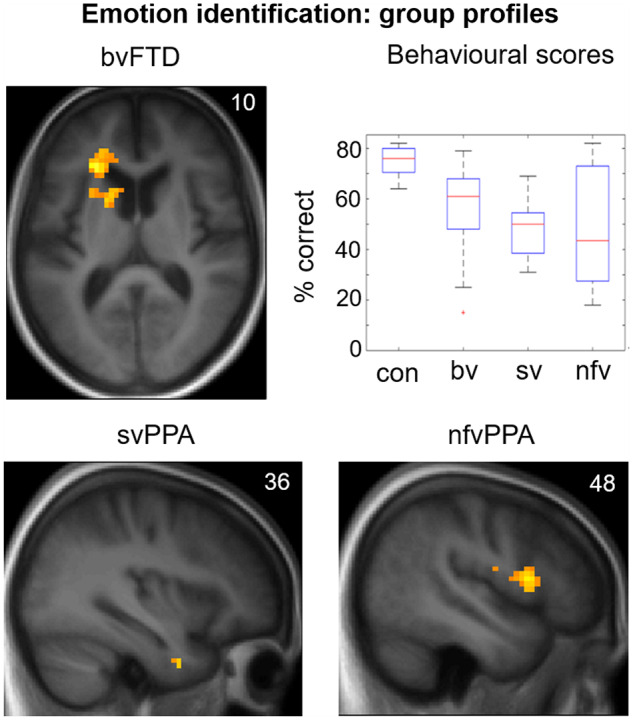
Figure 3.

Emotion identification: behavioural results and functional neuroanatomy. The figure displays statistical parametric maps (SPMs) for the T-contrast (facial emotion > dynamic mosaic) in each patient group, with score on the post-scanner emotion identification task as predictor variable in order to show the key determinants of identification ability separately within each group (top left, bottom), together with a plot showing performance (per cent correct) on the emotion identification task by participant group (top right; box and whisker plots display median, interquartile range, minimum and maximum values, with outliers appearing as red crosses). SPMs are thresholded at the cluster-defining threshold of P < 0.005 uncorrected (all loci displayed on the sections shown were significant at PFWE < 0.05 at whole brain or in pre-specified regions of interest (see Table 3 for details) and displayed on sections of the structural group mean T1-weighted template brain image. The plane of each section (in mm in MNI space) is shown in the top right of each image; the axial section shows the left hemisphere on the left. bv = patient group with bvFTD; con = healthy control group; nfv = patient group with nfvPPA; sv = patient group with svPPA.
