
Figure 5.
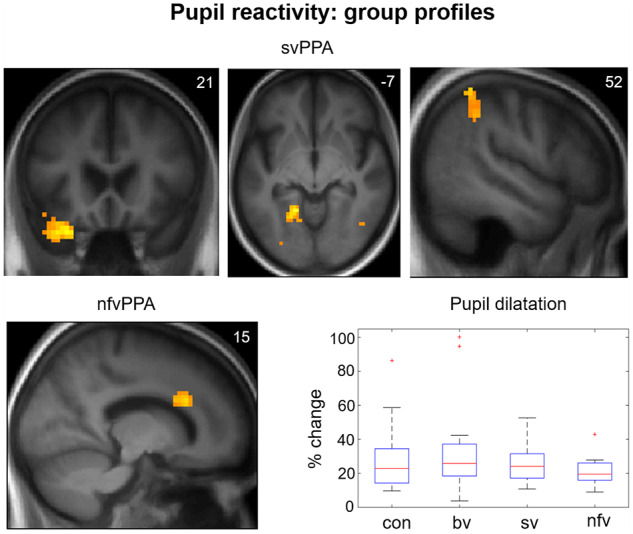
Pupil reactivity: pupil size change and functional neuroanatomy. The figure displays statistical parametric maps (SPMs) for the T-contrast (facial emotion > dynamic mosaic) in the svPPA and nfvPPA patient groups, with pupil reactivity as predictor variable. The plot (bottom right) shows mean pupil reactivity (per cent increase in pupil size from baseline) to facial expression stimuli by participant group (box and whisker plots display median, interquartile range, minimum and maximum values, with outliers appearing as red crosses). SPMs are thresholded at the cluster-defining threshold of P < 0.005 uncorrected and displayed on sections of the structural group mean T1-weighted template brain image. The plane of each section (in mm in MNI space) is shown in the top right of each image; axial and coronal sections show the left hemisphere on the left. bv = patient group with bvFTD; con = healthy control group; nfv = patient group with nfvPPA; sv = patient group with svPPA.