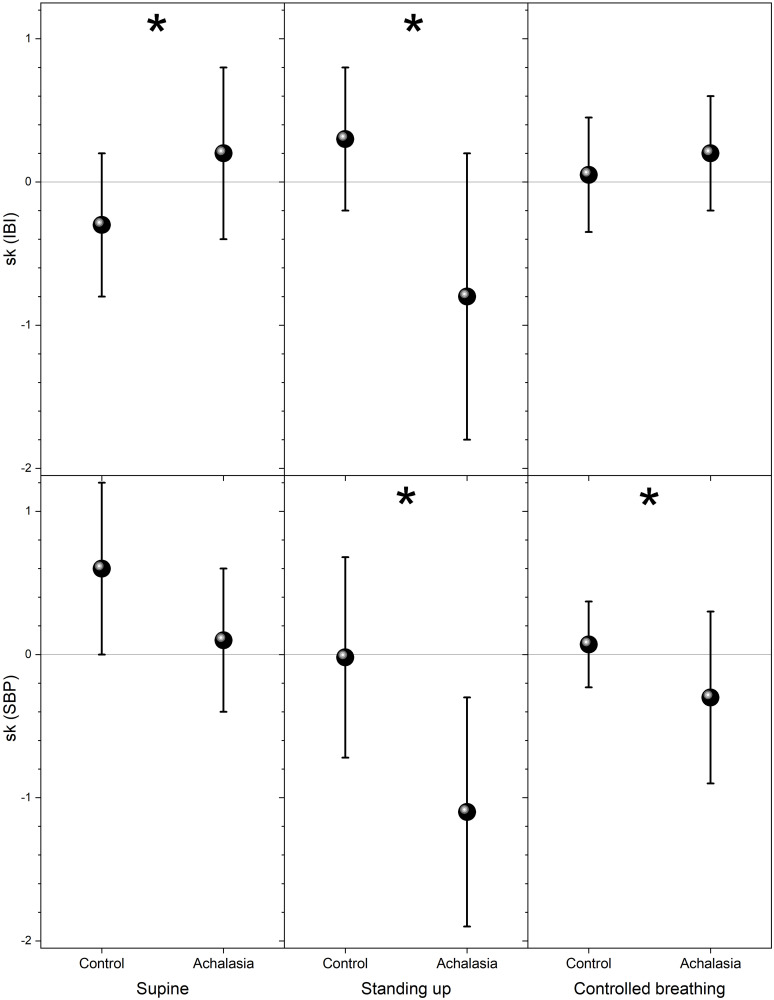
Fig 5. Skewness with respect to the median for control and achalasia groups during supine position (left-hand panels), standing up (middle panels), and controlled breathing (right-hand panels), IBI (top row), and SBP (bottom row).
The vertical crosshair corresponds to one standard deviation around the population average, while the dot is the median; * indicates statistically significant difference with respect to control (p value <0.05).

