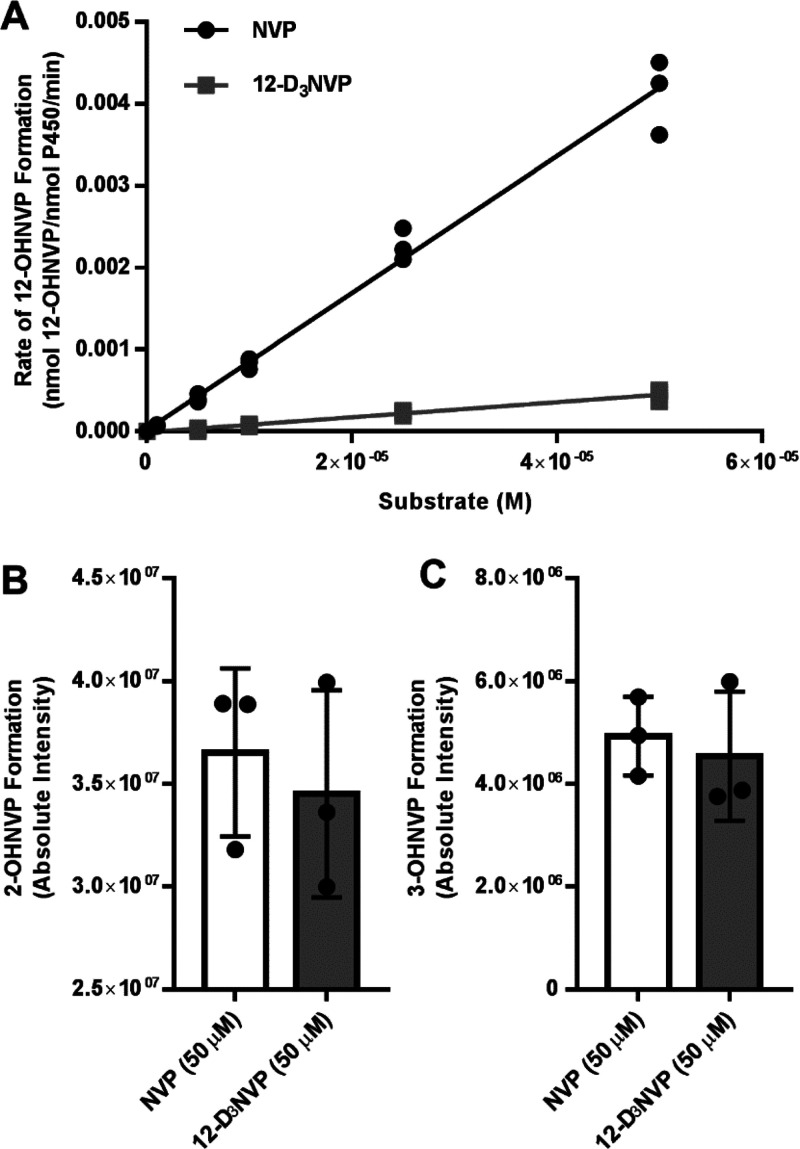
Figure 5.
Rate of 12-OHNVP production as well as 2- and 3-OHNVP formation from NVP and 12-D3NVP in human liver microsome incubations. Liver microsomes (2.5 mg/mL) prepared from pooled human donor livers were incubated with a range of concentrations of NVP (0, 1, 5, 10, 25, and 50 μM) or 12-D3NVP (0, 5, 10, 25, and 50 μM) and NADPH regenerating reagents for 30 min. Cytochrome P450 metabolites extracted from these incubations were measured using uHPLC-MS/MS (Orbitrap) detection. Metabolites were monitored using MS/MS scans for the following transitions: 283.1190 → 223.1104 m/z (12-OHNVP), 285.1315 → 225.1230 m/z (12-OHD2NVP), 283.1190 → 161.0709 m/z (2-OHNVP), 286.1378 → 161.0709 m/z (2-OHD3NVP), 283.1190 → 242.0798 m/z (3- OHNVP), and 286.1378 → 245.0987 m/z (3-OHD3NVP). The rate of formation of 12-OHNVP (A) was quantified by comparing peak areas of 12-OHNVP or 12-OHD2NVP to those of a standard curve of 12-OHNVP prepared in liver microsomal incubations without NADPH regenerating reagents. Formation of 2-OHNVP (B) and 3-OHNVP(C) from 50 μM NVP or 12-D3NVP is also shown. For rates of 12-OHNVP production, all data points are shown, in addition to results of linear curve fitting for the graphs of rate vs substrate concentration. For 2- and 3-OHNVP production, data are representative of the mean ± standard deviation of three experimental replicates.

