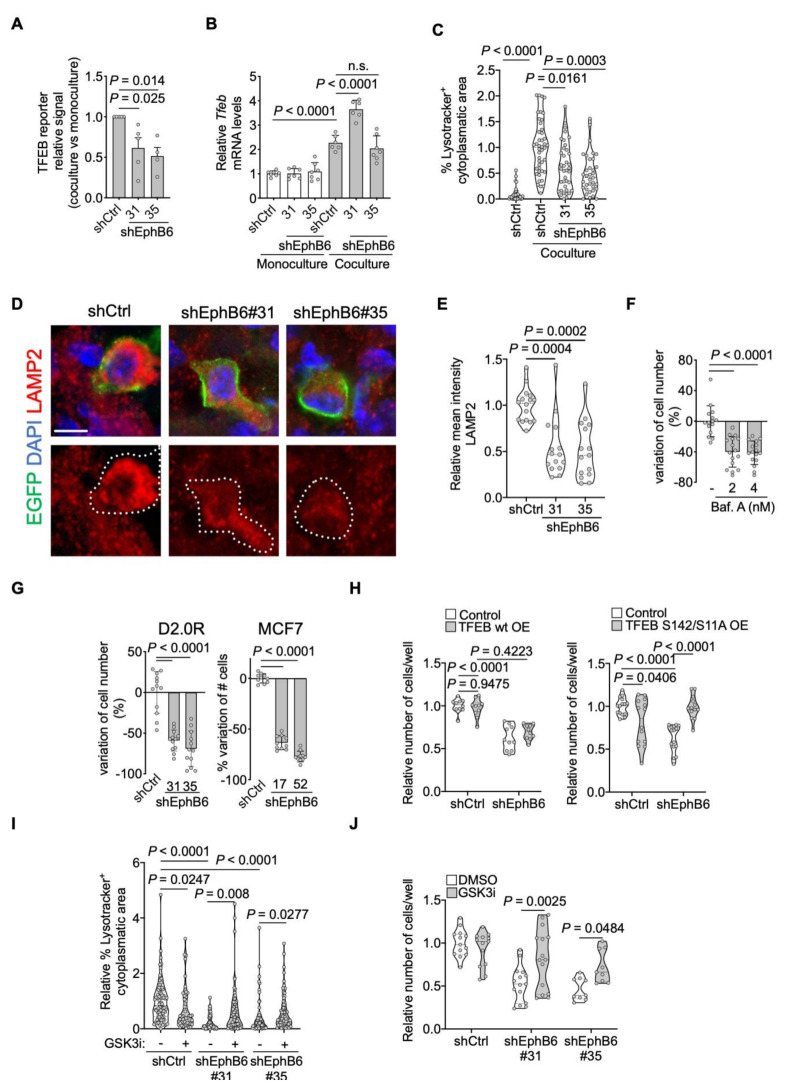
Figure 5.
EphB6 regulates the TFEB-lysosomal axis. (A) Relative induction (coculture with AT1-like cells Vs monoculture) of transfected TFEB-luciferase reporter in D2.0R-EGFP cells stably expressing the indicated shRNAs. n = 5 (shCtrl and shEphB6#31) or 4 (shEphB6#35) independent experiments. One-way ANOVA multiple comparisons test. Mean with SEM. (B) Relative mouse Tfeb mRNA levels in monocultured or cocultured shControl- or shEphB6-D2.0R-EGFP cells. Mean normalized values from n = 3 independent experiments. One-way ANOVA. Mean with SD. (C) Relative percentage of the cytoplasm with positive Lysotracker signal in D2.0R-EGFP cells with indicated shRNAs upon coculture with AT1-like cells, or in monoculture. Mean normalized from n = 3 independent experiments. Kruskal-Wallis multiple comparisons test. Same results with MCF7-EGFP cells in Figure S3B. (D) Representative images of lysosomal membrane protein LAMP2 in control D2.0R-EGFP cells or cells with EphB6 knockdown after dissemination to lung parenchyma quantified in (E). Scale bar, 5 μm. (E) Relative mean intensity of LAMP2 in lung disseminated shCtrl-, or shEphB6-D2.0R-EGFP cells. Three mice/sample. Kruskal-Wallis multiple comparisons test. (F) Variation of D2.0R-EGFP cell number after inhibition of lysosomal acidification inhibition with Bafilomycin A1 treatment. Mean normalized samples from n = 3 independent experiments. Kruskal-Wallis test. Mean with SD. (G) Variation of cell number of D2.0R-EGFP and MCF7-EGFP upon shEphB6 knock-down in coculture with AT1-like cells. Mean normalized pooled samples from n = 3 independent experiments. One-way ANOVA. Mean with SD. (H) Relative number of cocultured cells, shControl or shEphB6#31-D2.0R-EGFP, stably expressing hTFEB wild-type (left) or hTFEB-S142/211A (right). Mean normalized samples from n = 2 independent experiments. Two-way ANOVA, multiple comparisons. (I) Relative percentage of the cytoplasm with positive Lysotracker signal in D2.0R-EGFP cells with indicated shRNAs upon coculture with AT1-like cells, treated or not with 0.5 µM CHIR99021 for 48 h. Mean normalized from n = 3–4 independent experiments. Kruskal-Wallis multiple comparisons test. (J) Relative number of cocultured cells, shControl or shEphB6#31-D2.0R-EGFP, treated or not with CHIR99021 for 5 days. Mean normalized samples from n = 3 independent experiments. Two-way ANOVA, multiple comparisons.

