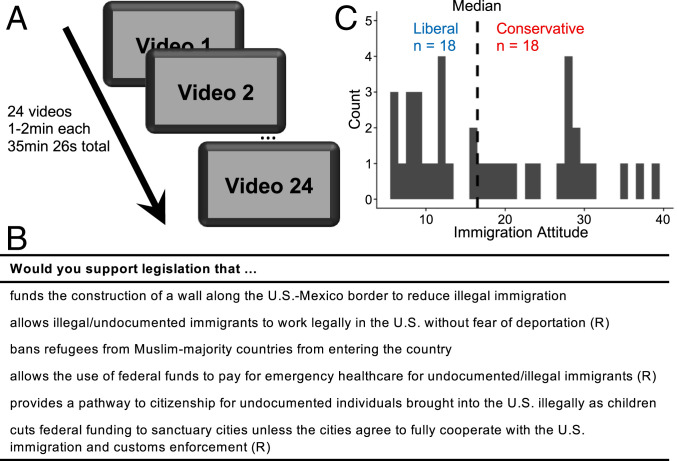
Fig. 1.
Experimental design. (A) Participants watched 24 videos on six immigration policies while undergoing fMRI. URLs to a subset of the videos are listed in SI Appendix, Table S2. (B) Prior to the experiment, participants indicated their support for each policy on a seven-point scale. Three of the questions, indicated here with (R), were reverse-coded such that higher ratings indicate stronger support for the conservative position while lower ratings indicate stronger support for the liberal position. (C) We tallied participants’ responses to compute their Immigration Attitude score and performed a median split to identify liberal-leaning and conservative-leaning participants.

