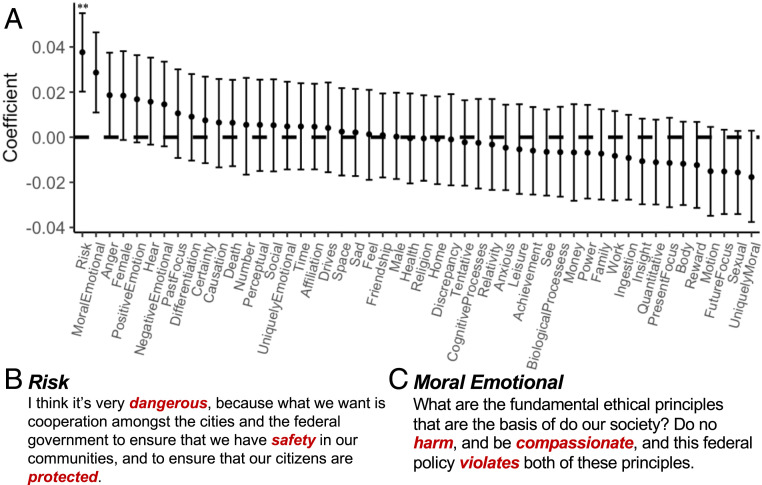
Fig. 4.
Relationship between semantic content and neural polarization in DMPFC. (A) Regression coefficients estimated using linear mixed-effects models. Error bars indicate 95% confidence intervals. (B) Red font indicates examples of risk-related words. (C) Red font indicates examples of moral-emotional words. **Holm–Bonferroni-corrected: P < 0.01.

