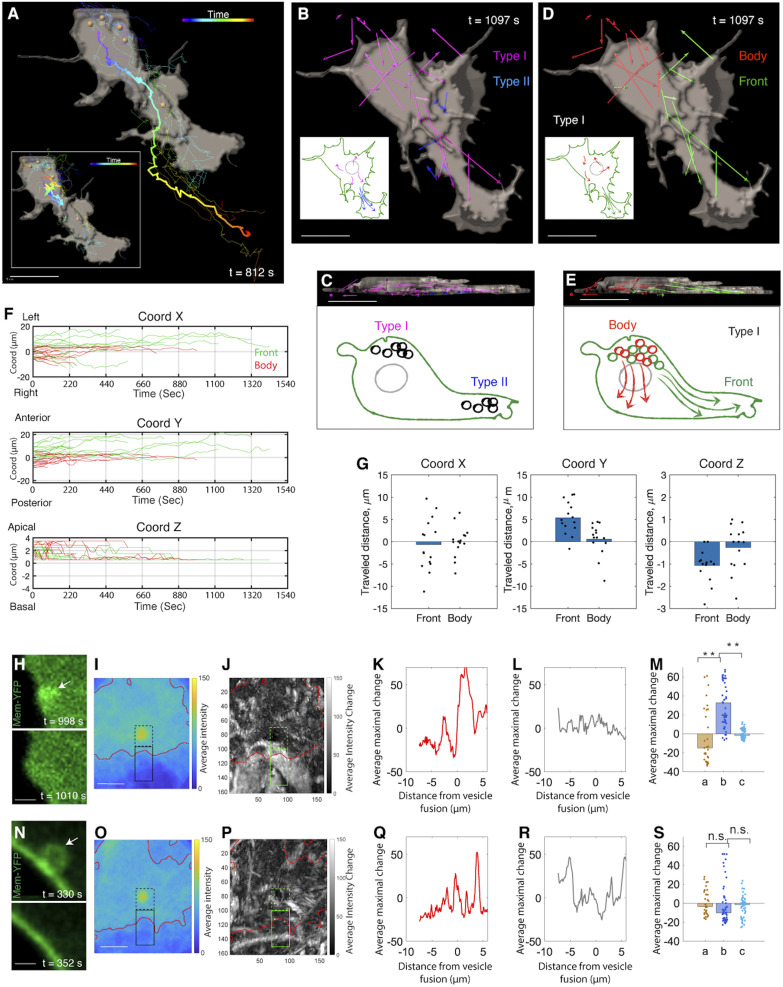
Fig. 2.
Anterograde flow of type I vesicles expands the lamellipodium. (A) A segmented view of a migrating cell with its trajectory color-coded according to time (thick line). All of the vesicles inside the cell are segmented (yellow dots), and their trajectories are mapped (thin lines). (Inset) Vesicle motion is normalized relative to the movement of the center of the cell body. (Scale bar: 5 µm.) (B and C) Two types of vesicles from top (B) and lateral (C) view. The lengths of the net displacement vectors of type I and II vesicles are proportional to their moving distance inside the cell. The schematics illustrate vesicle trajectories. (Scale bars: 5 µm.) (D and E) Two subpopulations of type I vesicles from top (D) and lateral (E) view. Their net displacement vectors are presented with the ones moving to the front and the other moving inside the cell body. (Scale bars: 5 µm.) (F) Trajectory analysis of type I vesicles based on the coordinate system in Fig. 1C. The trajectories are color-coded according to their destinations along the anterior-posterior axis (y axis) (n = 15 and 18 for green and red, respectively). Green tracks show upward shift in this direction, meaning that these vesicles move toward the cell’s front end. Along the x axis, upward shift of many green lines reflects lamellipodial extension toward the cell’s left side. n = 3 cells. (G) Distance analysis confirms that the vesicles moving to the cell front show maximal displacement (along the y axis). n = 15 and 18 for vesicles moving to the front and in the cell body, respectively. n = 3 cells (rank sum test, x: P = 0.724; y = 0.001; z: P = 0.018). (H–M) Vesicles moving to the cell front expand the lamellipodium. (H) Two representative time frames showing vesicle (arrow) fusion into the membrane causes membrane protrusion. (I–M) Quantification (Methods). (I) The average intensity near the vesicle before fusion. The red contour shows the approximate cell membrane. The dashed and solid black contours show fluorescent signal inside and outside of the cells, respectively. (J) Average intensity change due to vesicle fusion. (K–M) The average maximum intensity changes as a function of distance from the site of vesicle fusion. Signal intensity decreases in the intracellular regions while increases in the extracellular regions (K); this is not observed in the random dataset (L). (M) Summary of the results in K and L (a: intracellular changes, b: extracellular changes, c: extracellular changes in the random dataset) (rank sum test, **P < 0.001, n = 31 pixels representing the average across 36 vesicles). (N–S) Vesicle motion in the cell body does not impact cell morphology. (N) Two representative time frames. The same analysis in I–M is applied here. Note that the extracellular changes of the membrane (b) in S is not significantly different to intracellular changes (a) and the random dataset (c). n = 3 cells (rank sum test, n = 31 pixels representing the average across 36 vesicles). n.s., not significant. (Scale bars for H, I, N, O: 1 µm.)

