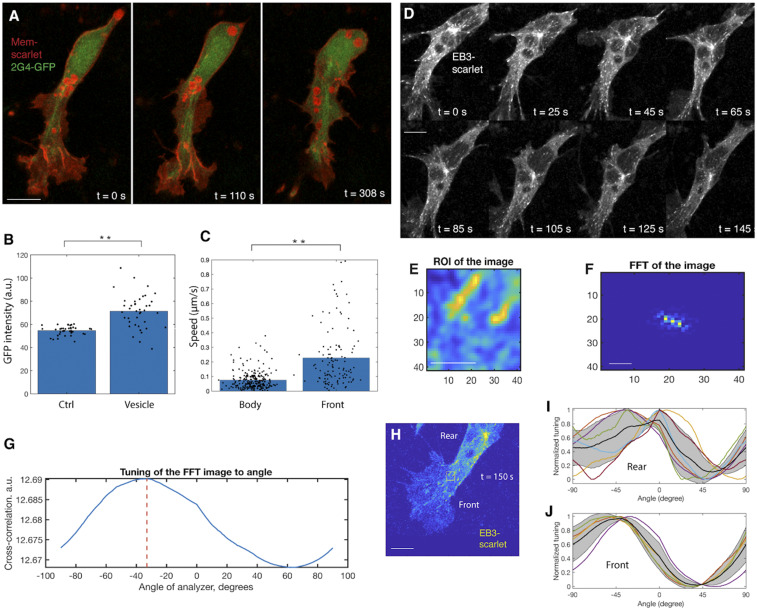
Fig. 3.
MTs mediate anterograde flow of type I vesicles. (A and B) Live imaging of vesicle movement along MTs (A). (B) Fluorescence colocalization analysis shows that MT amount (2G4-GFP intensity) is higher in the region enriched with vesicles (Membrane-YFP intensity) compared with in the region without vesicles (Ctrl) (rank sum test, **P < 0.001, n = 3 cells). (C) Speed analysis shows that vesicles in the lamellipodium move faster (rank sum test, **P < 0.001, n = 3 cells). (D) Higher-frequency (collecting a frame every 5 s) imaging of MT plus ends. (Scale bar: 4 µm.) (E–G) Approach to measuring the orientation of MT plus ends (Methods). (E) In the region of interest (ROI), individual EB3 signal in D is zoomed in such that its shape can be clearly visualized. (F) For individual EB3 signal, its 2D fast Fourier transform (FFT) representation is calculated. (G) The cross-correlation between the orientation of FFT image and the long axis of cells is measured. This cross-correlation value represents the relative orientation of EB3 with respect to the cell. (H–J) Distinct flow orientation of MTs in the lamellipodium and in the cell body. In a randomly selected time frame (H), the approach introduced in E–G is applied to measure the orientation of EB3 flow. In I and J, bold black lines are the mean cross-correlation value for all EB3 signal. Gray area signifies SD, which positively correlates with the orientation of EB3. The higher SD in the cell body (I) than in the cell front (J) suggests that EB3 flow in the cell front end is more oriented. (Scale bar in H: 1 µm.)

