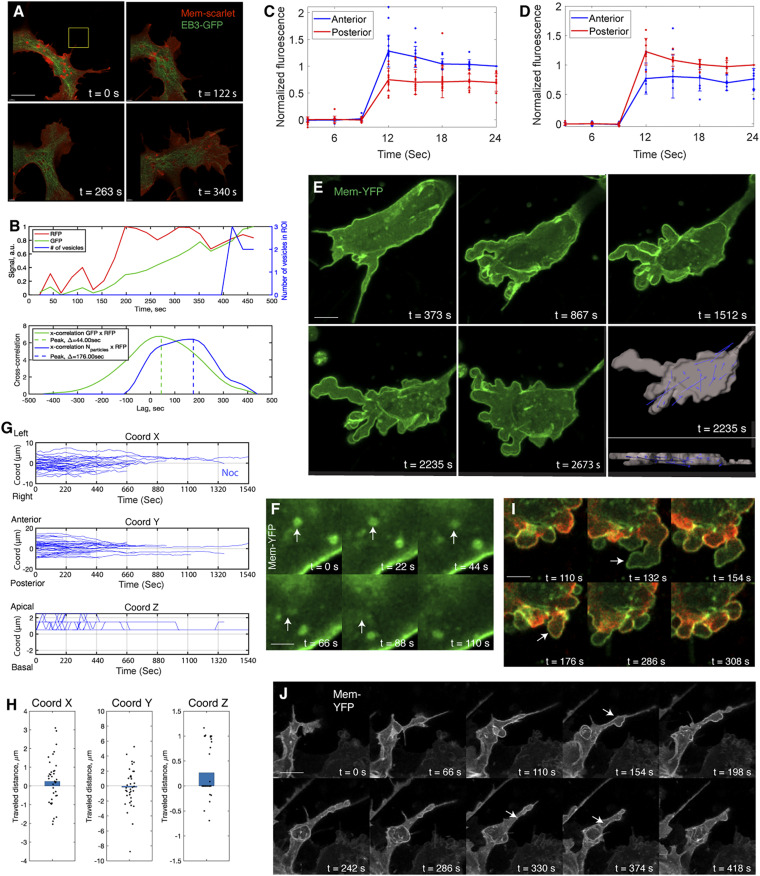
Fig. 6.
Blocking MT polymerization interferes vesicle flow and lamellipodial formation. (A and B) Live imaging shows membrane protrusion occurs in advance of MT flow and vesicle flow (A). A window (yellow) is drawn in the direction of membrane extension, and the evolution of fluorescence signal of membrane, MT, and vesicles within this window is measured (B). B, Upper shows the sequential movements of the membrane, MT, and vesicles. (Scale bar in A: 4 µm.) (C and D) Normal membrane flow in the nocodazole-treated cells. The same photo-conversion assay to Fig. 1E is performed. (C) Photo-conversion on the basal side of the cells expressing Farnesylated-Dendra2 shows the red fluorescence move more quickly to the anterior end than to the posterior end (rank sum test at frame 4, P < 0.001, n = 12 cells). The same analysis on the apical side reveals posterograde membrane flow (rank sum test at frame 4, P < 0.05, n = 7 cells) (D). (E) Live imaging of a treated cell; note that the cell does not form the lamellipodium. In the segmented image, the displacement vectors are more randomized than the ones moving to the front in the normal cells in Fig. 2D. (Scale bar: 5 µm). (F) Live imaging to show vesicle fission (arrows) in the treated cells. (Scale bars: 2 µm.) (G) Trajectory analysis reveals abnormal vesicle movement in the treated cells. In both the medio-lateral (x axis) and anterior-posterior (y axis) directions, all of the lines extend toward 0 (the center of the cell body), demonstrating that vesicle motion is restricted within the cell body. (H) Distance analysis reveals minimal movement of the vesicles along the anterior-posterior axis of the treated cells (y axis), relative to their mobility in the normal cells in Fig. 2G, n = 35 vesicles, n = 3 cells (rank sum test, P < 0.001, x: P = 0.241; y: P = 0.692; z: P = 0.004). (I) The treated cells are blebbing. The expanding region is almost devoid of F-actin (t = 132 s, arrow); however, upon shrinkage, F-actin is enriched on the edge (t = 176 s, arrow) to exert contraction force. (Scale bar: 3 µm.) (J) Live imaging of noncanonical macropinocytosis in a treated cell. The ruffles on the cell body recede into the cytoplasm accompanied by vesicle delamination (arrows). The morphologies of these vesicles are not obvious due to fission. (Scale bar: 3 µm.)

