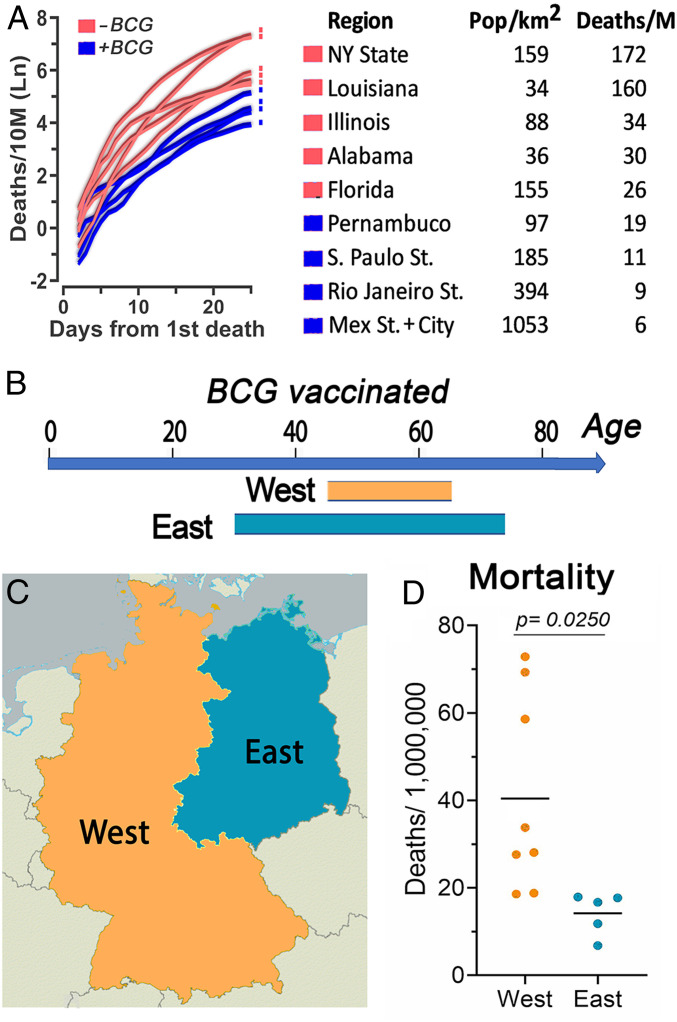
Fig. 3.
COVID-19 mortality in comparable regions that have had different BCG vaccination policies. (A) COVID-19 mortality by time in populous North and South American States. (Left) COVID-19 mortality per 10 million inhabitants in a 3-d centered average. Time adjusted according to the day with the first death in each region as day 1, up to 25 d of the epidemic. (Right) Table shows population density and COVID-19 mortality by day 25 of the epidemic for each region. Regions that have had BCG vaccination (blue) had lower mortality than regions without BCG vaccination (red; r2 = 0.84, P < 0.001; t [237] = 14.274, P < 0.001). (B) Estimated age range of people that received BCG vaccination in East and West Germany. (C) Map illustrating the regions of East and West Germany included in the analysis. (D) Mean COVID-19 mortality in East Germany was lower than mortality in West Germany (t [11] = −2.592, P = 0.025).

